
Tracking Access Measures of Women Students’ Application and Acceptance Rates at Walailak University
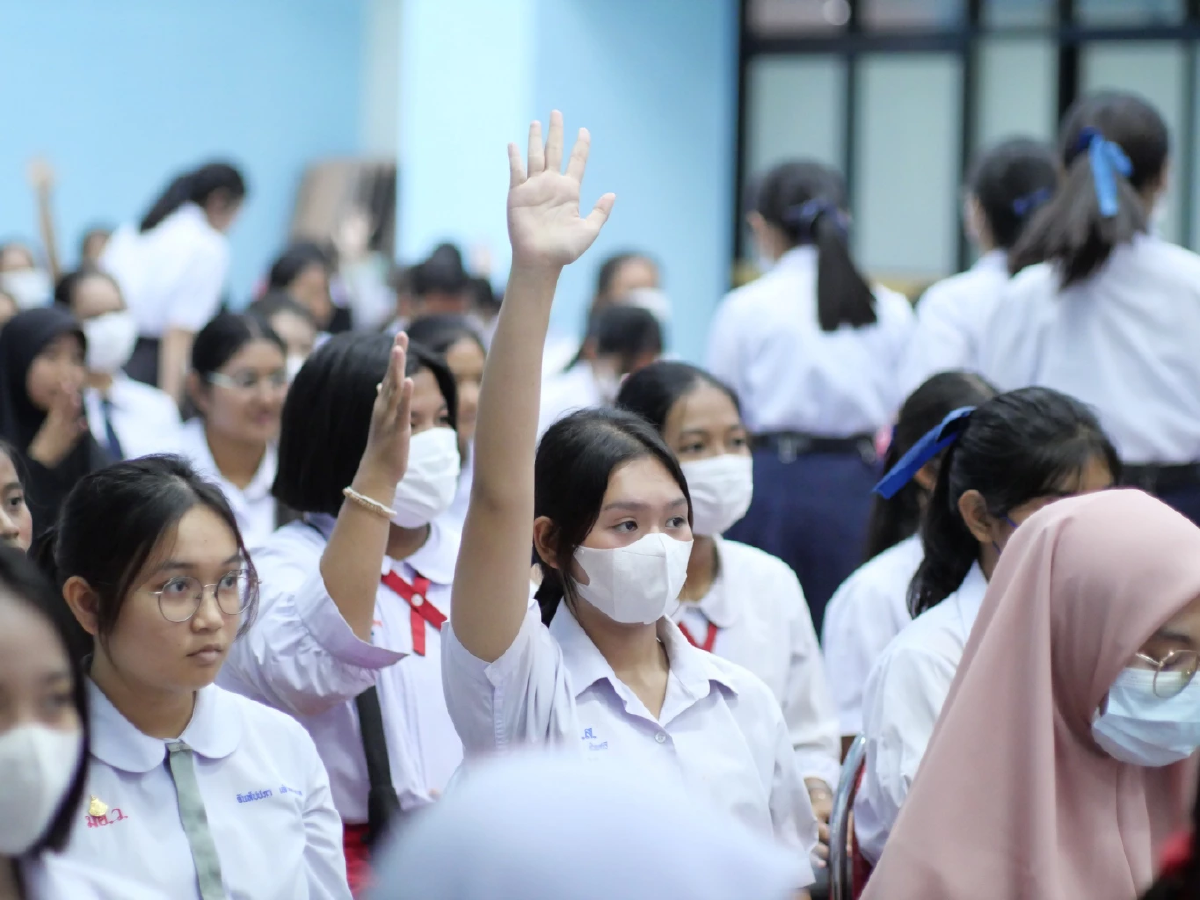
Figure: A group of female high school students applying to Walailak University in the School of Allied Health Sciences.
The CES has developed a website systematically collecting all the statistical data on SDG 2, SDG 3, SDG 4, and SDG 5, and other relevant statistical data. This website has been developed to show that Walailak University has placed importance on promoting gender diversity and inclusion as the website can provide information to the CES to identify and monitor trends and barriers that may deter women students from applying and participating in higher education. The website shows the number of women students each year and keeps updating the number of women students who have quit or participated at Walailak University. The website can be reached at https://ces.wu.ac.th/registrar/refer/sdg2.asp
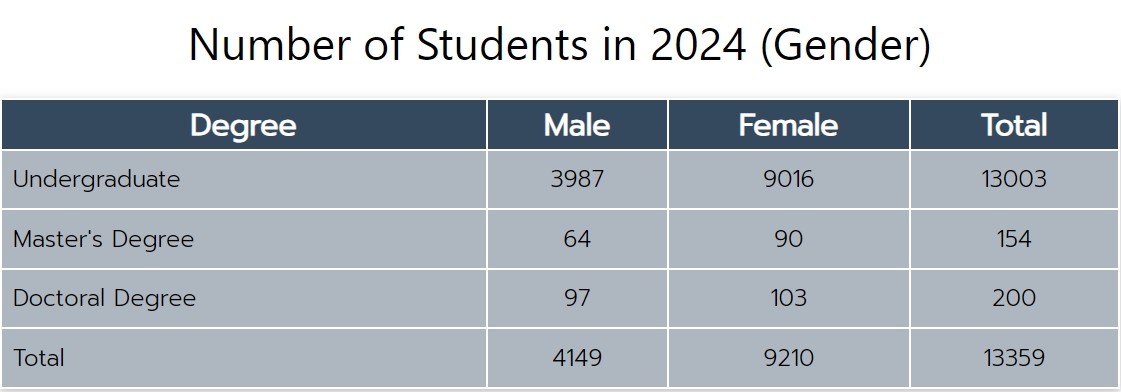
Figure: The table showing the number of women students’ acceptance rate compared to male students in the website.
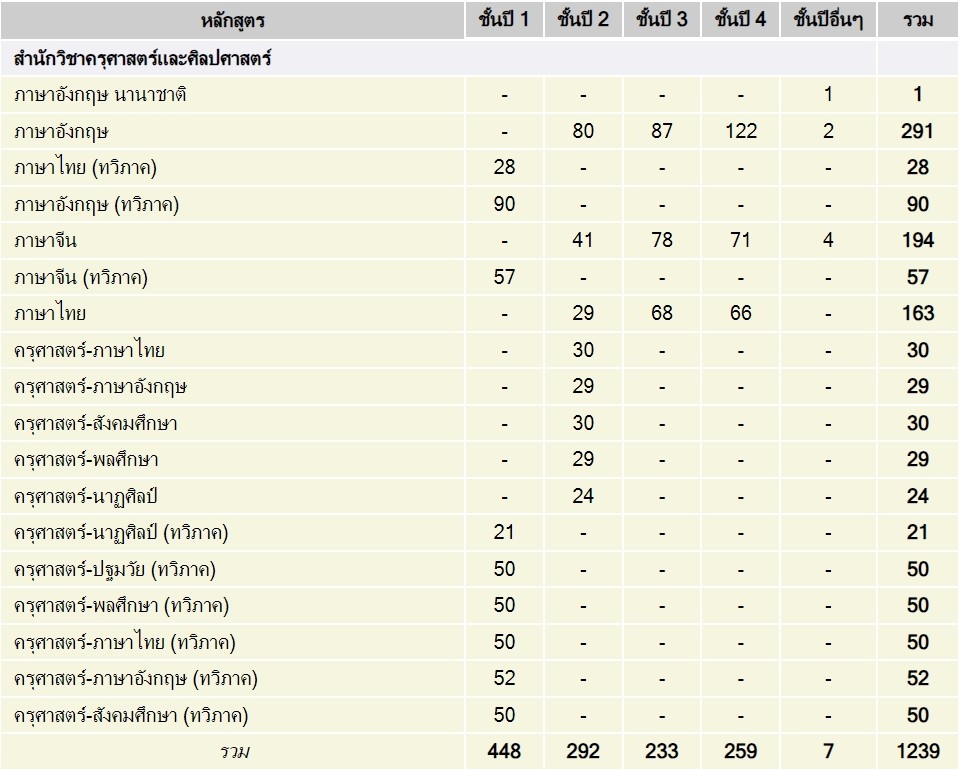
Besides, the Center for Educational Services has developed another website that provides more details about the number of female and male students in each of their program affiliations. The details are useful to the CES staff, who are responsible for tracking the acceptance rate of female students. The website can be reached at https://ces.wu.ac.th/registrar/student_total2.asp
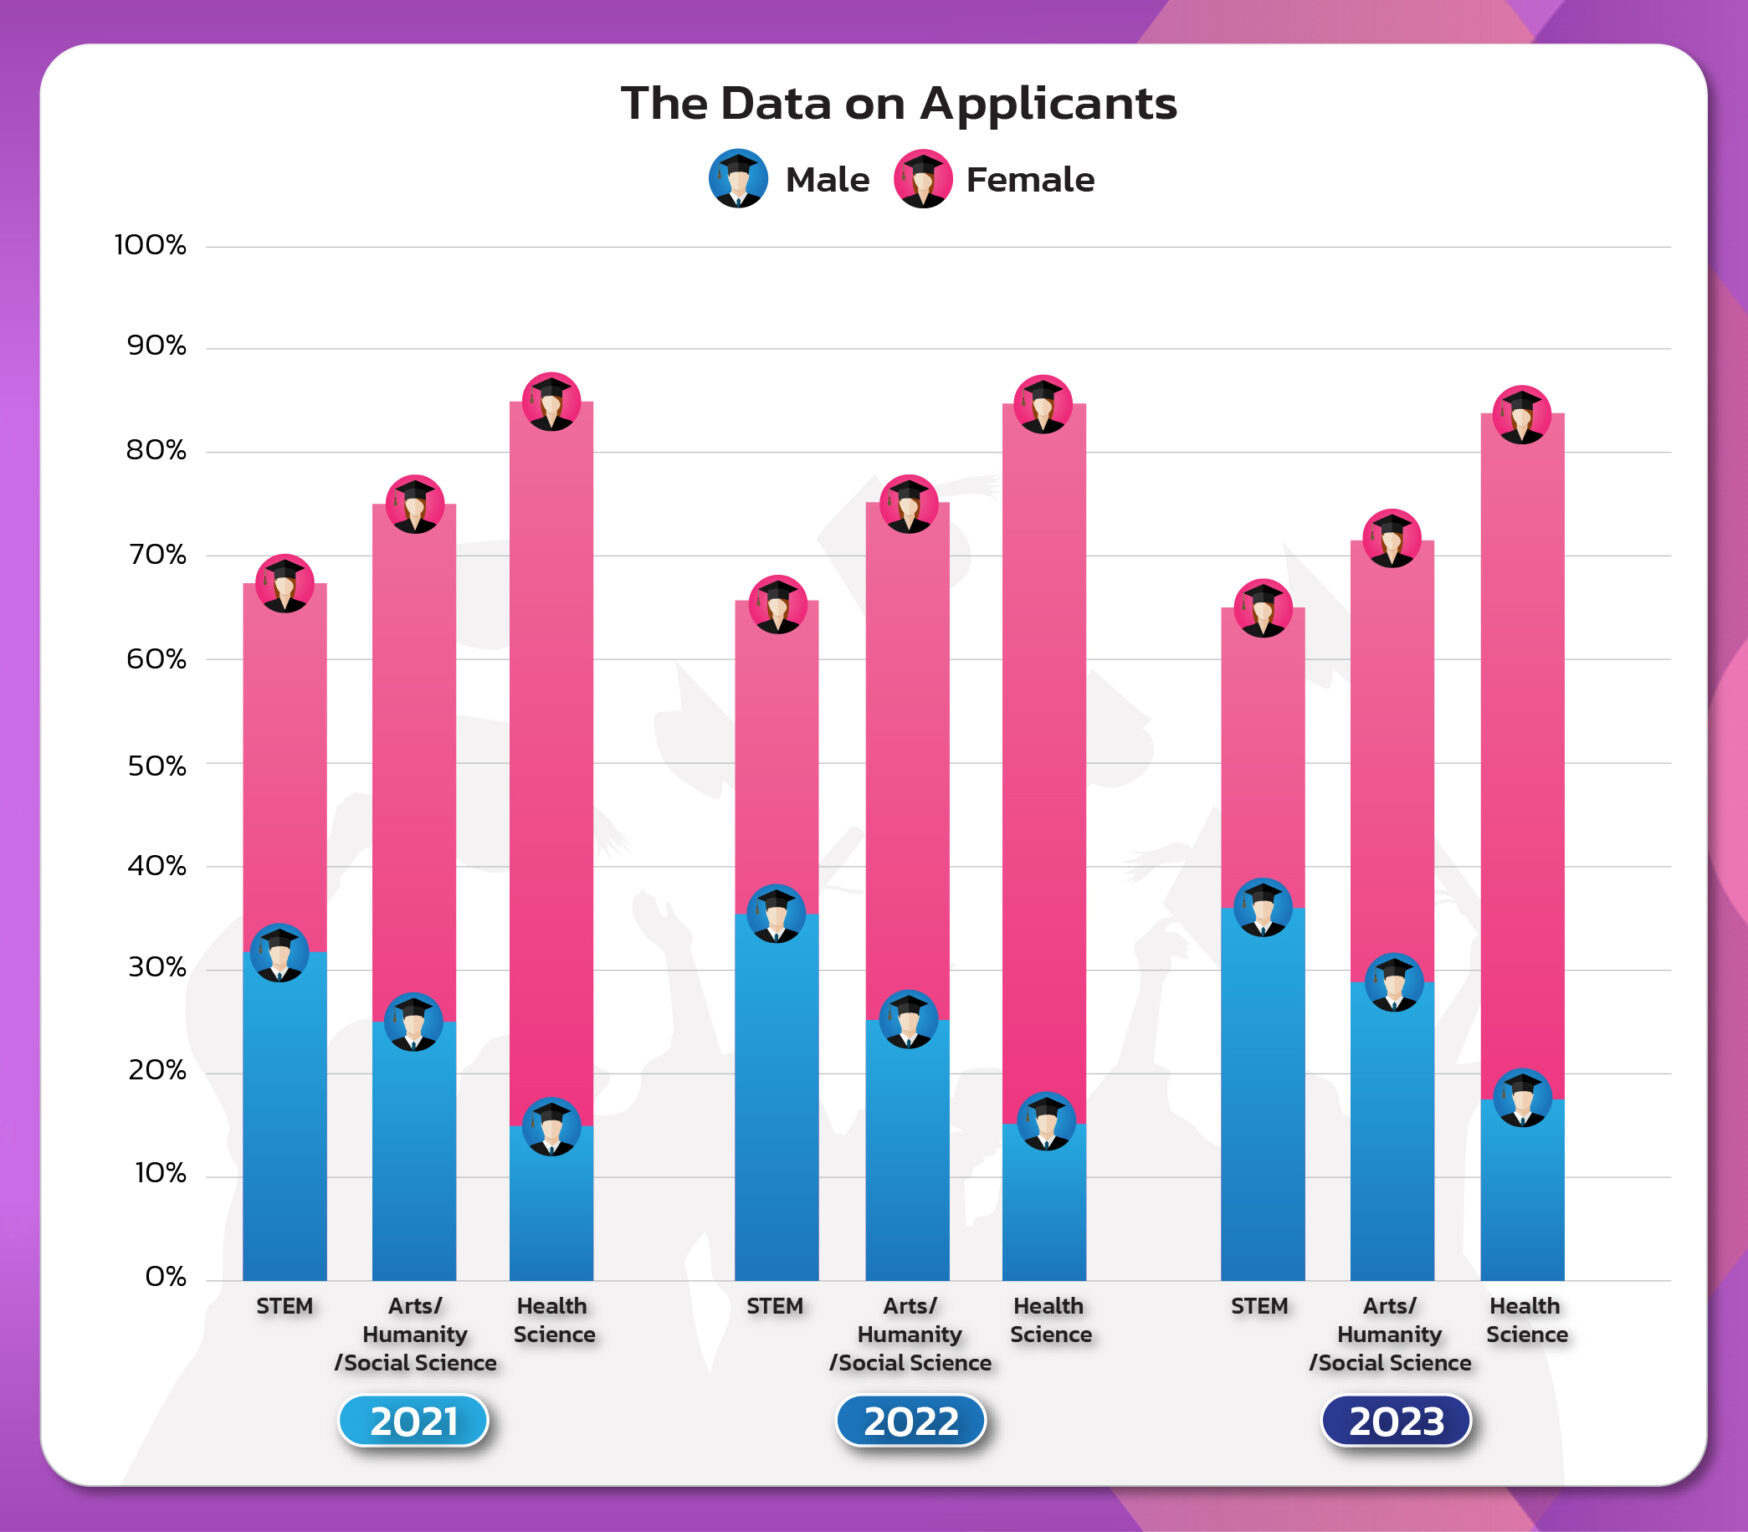
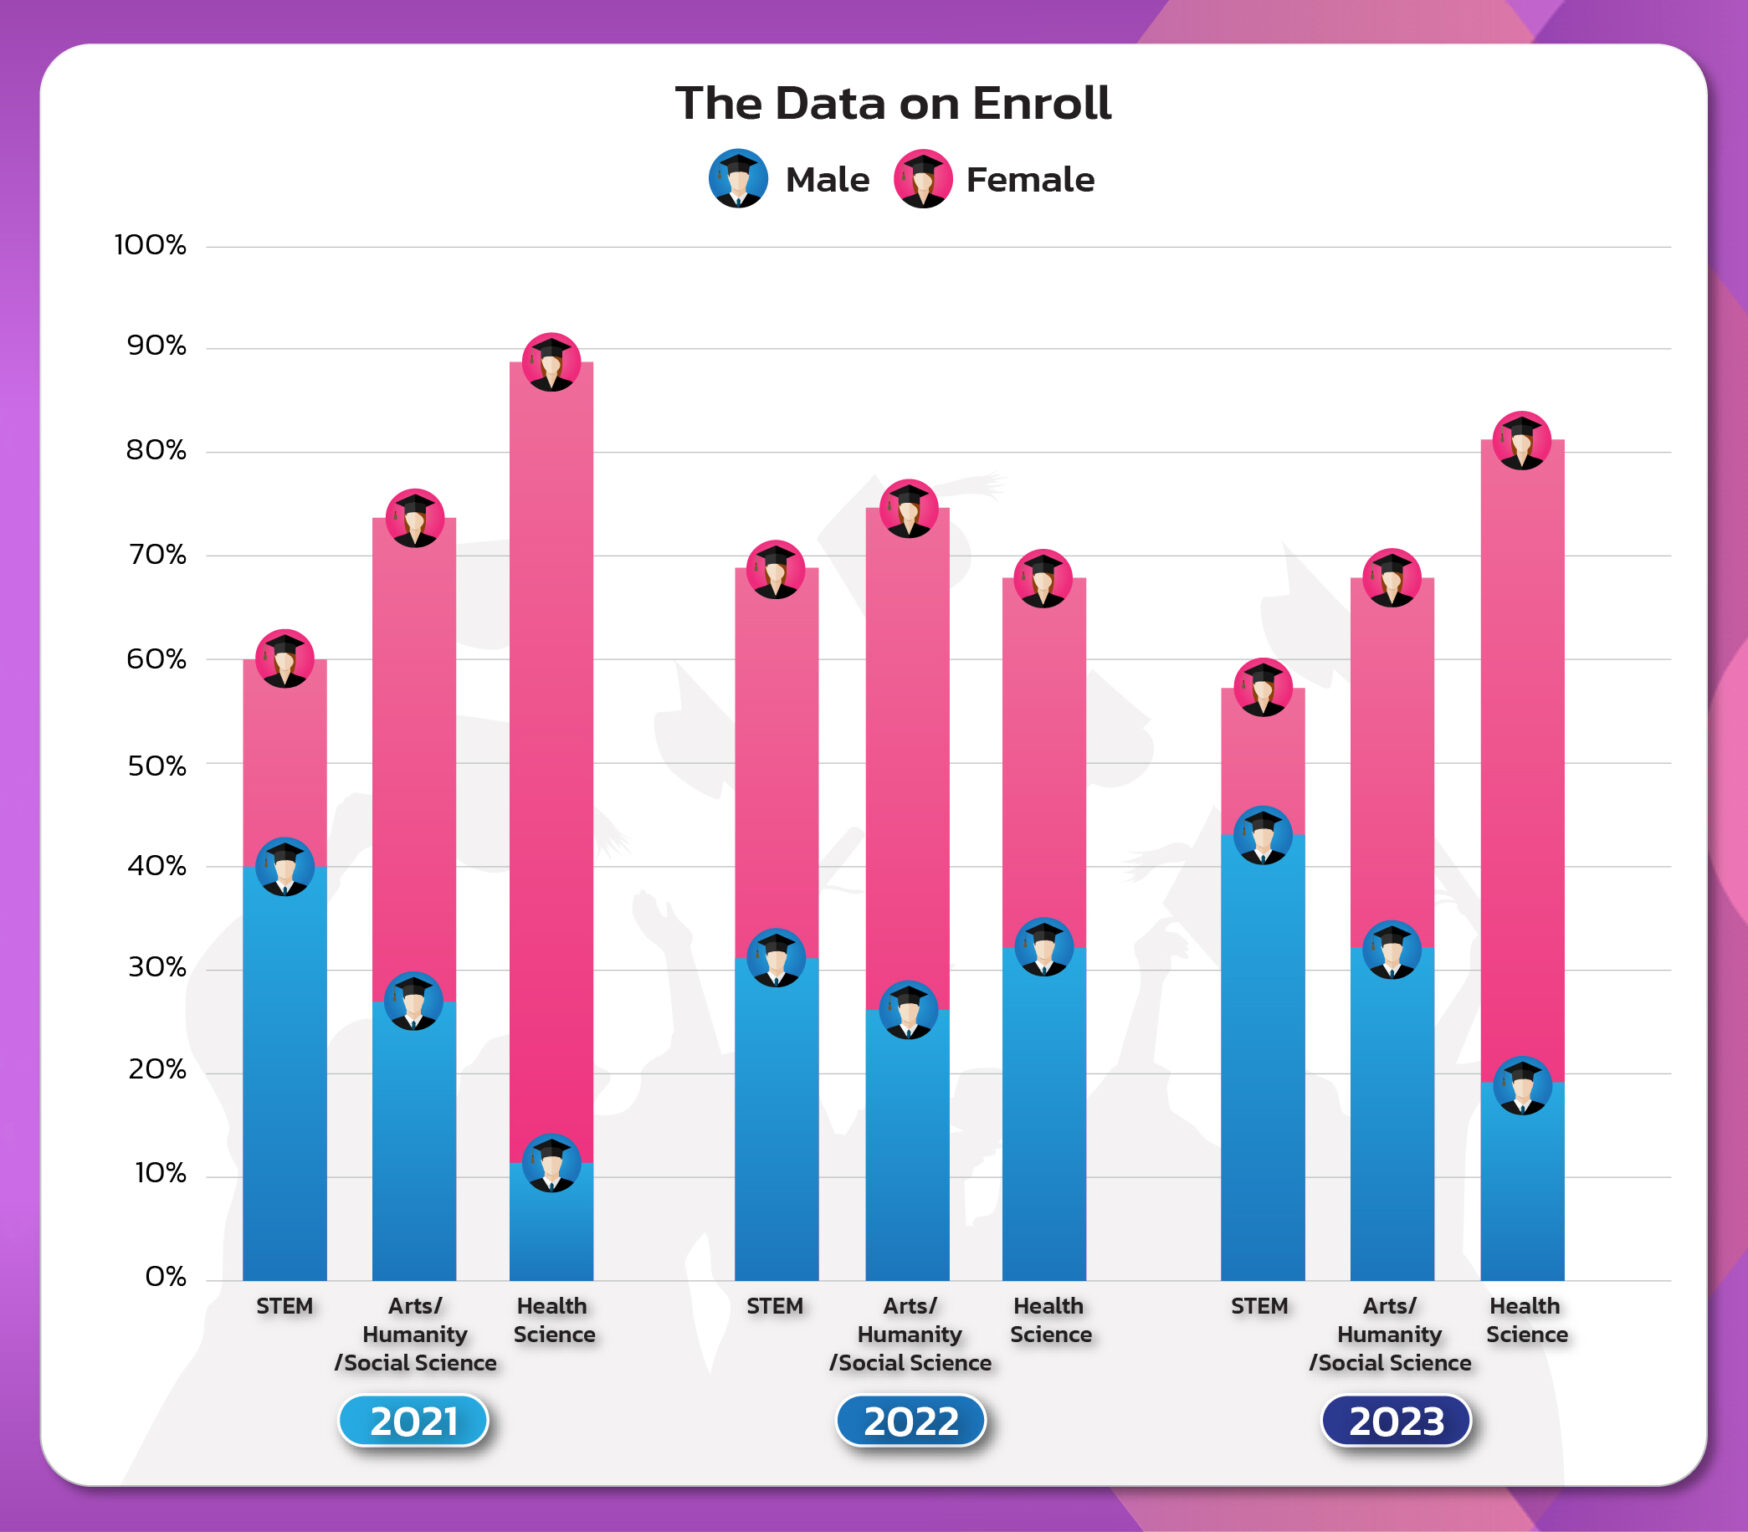

Female Enrollment Rate Comparing to Male Enrollment (%)
2021:
- Male Applicant Percentage: 17.49%
- Female Applicant Percentage: 82.51%
2022:
- Male Applicant Percentage: 18.72%
- Female Applicant Percentage: 81.28%
2023:
- Male Applicant Percentage: 18.94%
- Female Applicant Percentage: 81.06%
Female Enrollment Rate Comparing to Male Enrollment (%)
- 2021: 69.99%
- 2022: 45.58%
- 2023: 69.86%
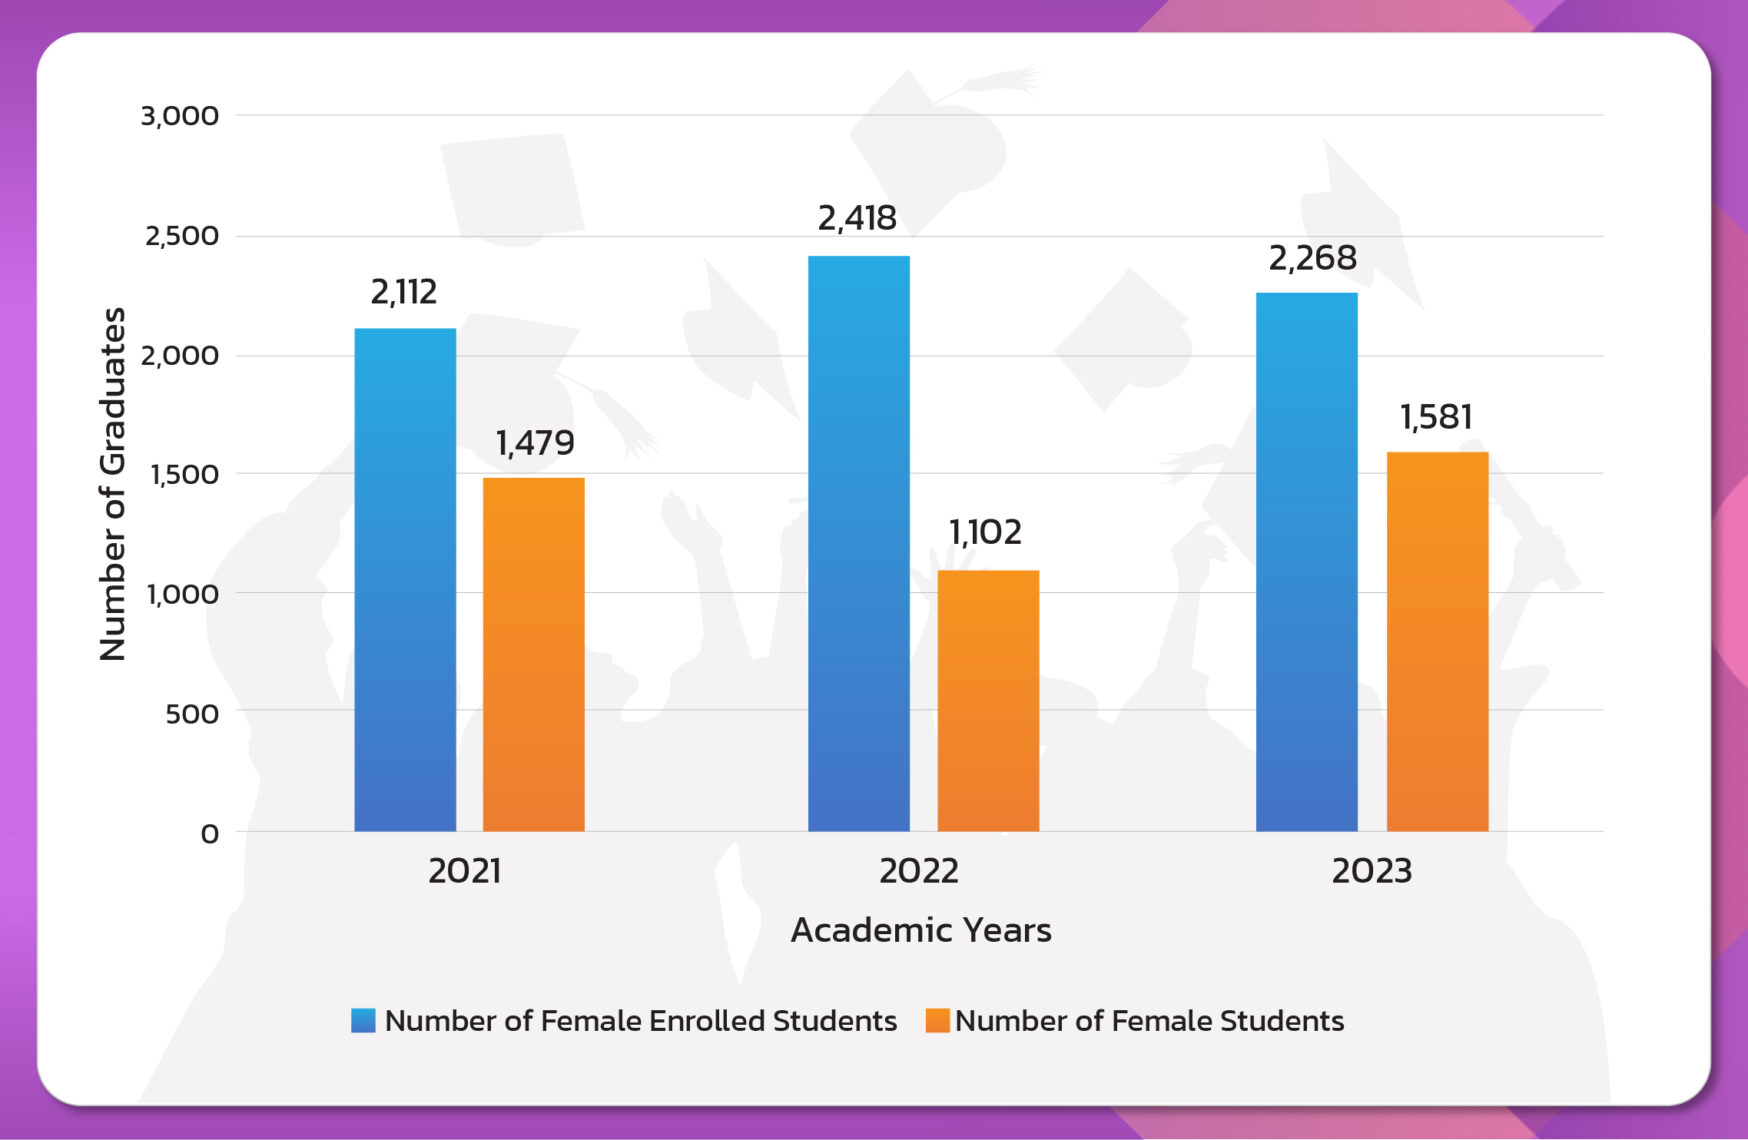
Figure: The number of female enrolled students and graduates in the academic year 2021-2023.