
Planning, implementation, monitoring and/or evaluation of all programs related to Waste Management through the utilization of Information and Communication Technology (ICT)
Planning, implementation, monitoring and/or evaluation of all programs related to Waste Management through the utilization of Information and Communication Technology (ICT)
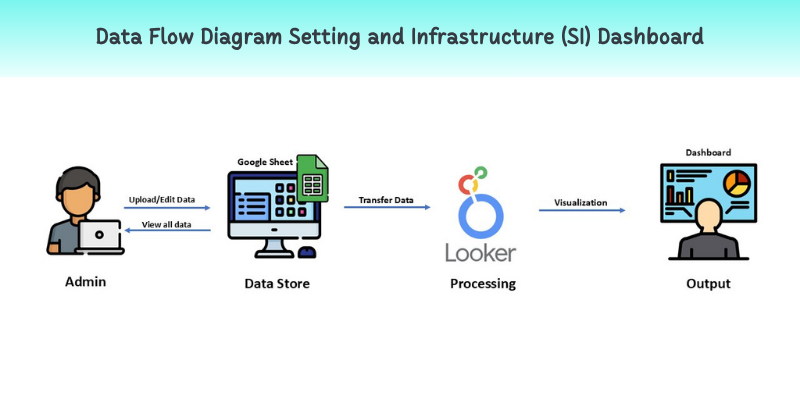
Figure 1 Planning, implementation, monitoring and/or evaluation of all programs related to Waste Management through the utilization of Information and Communication Technology (ICT)
Fifgure 2 Data Flow Diagram Waste Management Dashboard
Walailak University places great importance on continuous waste management to create a sustainable environment and reduce environmental impacts, in line with UI GreenMetric standards. The university implements systematic strategies for waste reduction, segregation, and recycling.
A key tool for monitoring is the waste management dashboard, which serves as a central platform for collecting and analyzing waste data from all areas of the campus. The dashboard provides critical information, including:
- Waste quantities by type: Data on organic waste, recyclable waste, general waste, and hazardous waste allow identification of high-waste areas and points for improvement.
- Waste management percentages: Displays the rates of waste segregation and recycling compared to the set targets, giving administrators and staff a clear view of the program’s effectiveness.
- Greenhouse gas (GHG) emissions: Shows the environmental impact from waste management activities, helping the university assess and reduce environmental impacts according to the Low Emission Support Scheme (LESS) by the Thailand Greenhouse Gas Management Organization (TGO).
Using the dashboard enables the university to track waste management performance in real time, analyze trends, identify areas needing improvement, and strategically plan for continuous waste reduction and higher recycling rates. Additionally, it supports reporting and evaluation according to UI GreenMetric indicators, allowing the university to communicate environmental progress transparently and effectively.
- Planning
- Analyze the current situation
- Survey the volume and types of waste in each building and area of the university
- Classify waste such as organic waste, recyclable waste, general waste, and hazardous waste
- Set objectives for the 3R project
- Reduce the amount of waste sent to landfill or incineration
- Increase recycling and reuse rates
- Promote awareness and participation among students and staff
- Plan the Dashboard
- Identify data to be collected, e.g., daily/weekly/monthly waste volumes by type
- Define KPIs, such as recycling rate (%) and waste reduction (%)
- Select platforms and tools for visualization, such as Excel, Power BI, or online systems
- Implementation
- Install 3R waste collection points
- Place segregated waste bins (Reduce, Reuse, Recycle) in buildings and public areas
- Use signage and communication materials to create understanding
- Conduct waste reduction activities
- Provide knowledge on reducing plastic and packaging waste
- Organize Reuse activities, such as material or equipment exchange
- Promote Recycling, e.g., collecting recyclable waste for factories
- Record waste collection data
- Establish a reporting system for waste volumes and types in a database
- Update data in the Dashboard in real-time or at appropriate intervals
- Monitoring
- Check project compliance
- Inspect proper use of bins and correct waste segregation
- Survey participation and cooperation among students and staff
- Monitor Dashboard data
- Verify waste volume figures and recycling rates
- Analyze trends and identify issues, e.g., misclassified waste
- Evaluation
- Measure project success
- Compare waste volumes before and after the project
- Assess waste reduction, increase in recycling rates, and cost savings in waste management
- Improve and develop the project
- Use data from the Dashboard and monitoring results to adjust the waste management plan
- Expand 3R activities to other buildings and areas
- Prepare summary reports on project performance for long-term planning
- Revision
The Academic Service Center at Walailak University reviewed and analyzed the evaluation results from the Waste Management Dashboard. Using Google Sheets and Looker Studio, the team revised data visualization and key indicators to improve accuracy and clarity. The updated dashboard was released mid-year (June) and end-year (September) to enhance monitoring and decision-making in campus waste management.
Figure 3 Dashboard for Organic Waste Management at the University
Figure 4 Dashboard for Inorganic Waste Management at the University
Figure 5 Dashboard for Inorganic Waste Management at the University
Figure 6 Real-time monitoring software for wastewater quality parameters at Walailak University
Figure 7 Results of Quarterly Water Quality Analasis from 2022 to 2025 at Walailak University