A Systematic and Sustainable System for Tracking and Managing Food Waste Across the Entire University
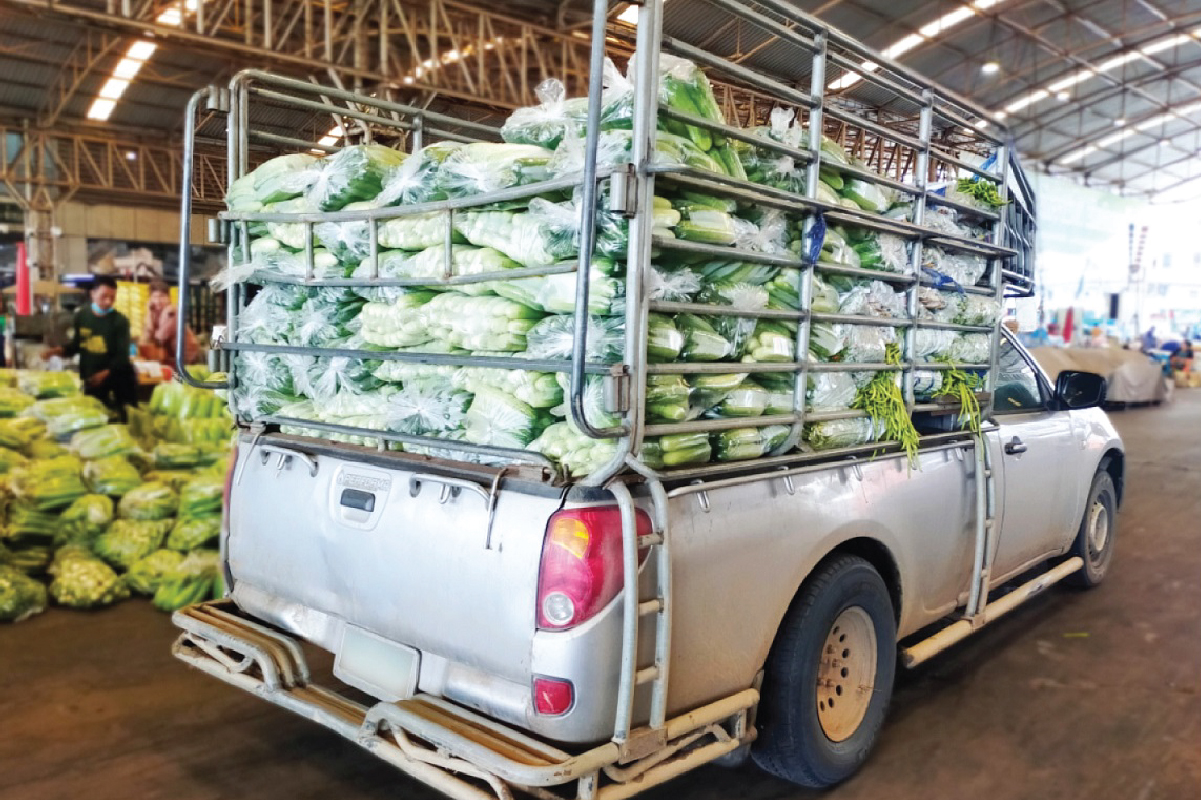
Food waste can occur at every stage of the food production process, from production, handling and storage, processing, and distribution to consumption. The causes of food waste are diverse, ranging from inadequate market systems, improper transportation of fresh products, and production of excess food, to purchasing or displaying large quantities, oversized meal portions, and the prevailing attitude that disposal is cheaper than reuse.
Recognizing these challenges, Walailak University has established a systematic approach to track and measure food waste generated within the campus from the campus population including students and employees. This monitoring system covers the whole university where food is consumed, including food centers, student dormitories, staff dormitories, academic buildings, administrative offices, and other relevant facilities. With effective methods for measurement and data collection, the university is able to accurately identify the volume of food waste produced. These data are then used to develop strategies for reducing food waste and improving sustainable food management practices. The responsibility for this monitoring system lies with the Center for Smart Farming and Landscape Architecture, which has been carrying out this work continuously for more than 10 years.
Tracking and Measuring Food Waste for Whole University in 2024
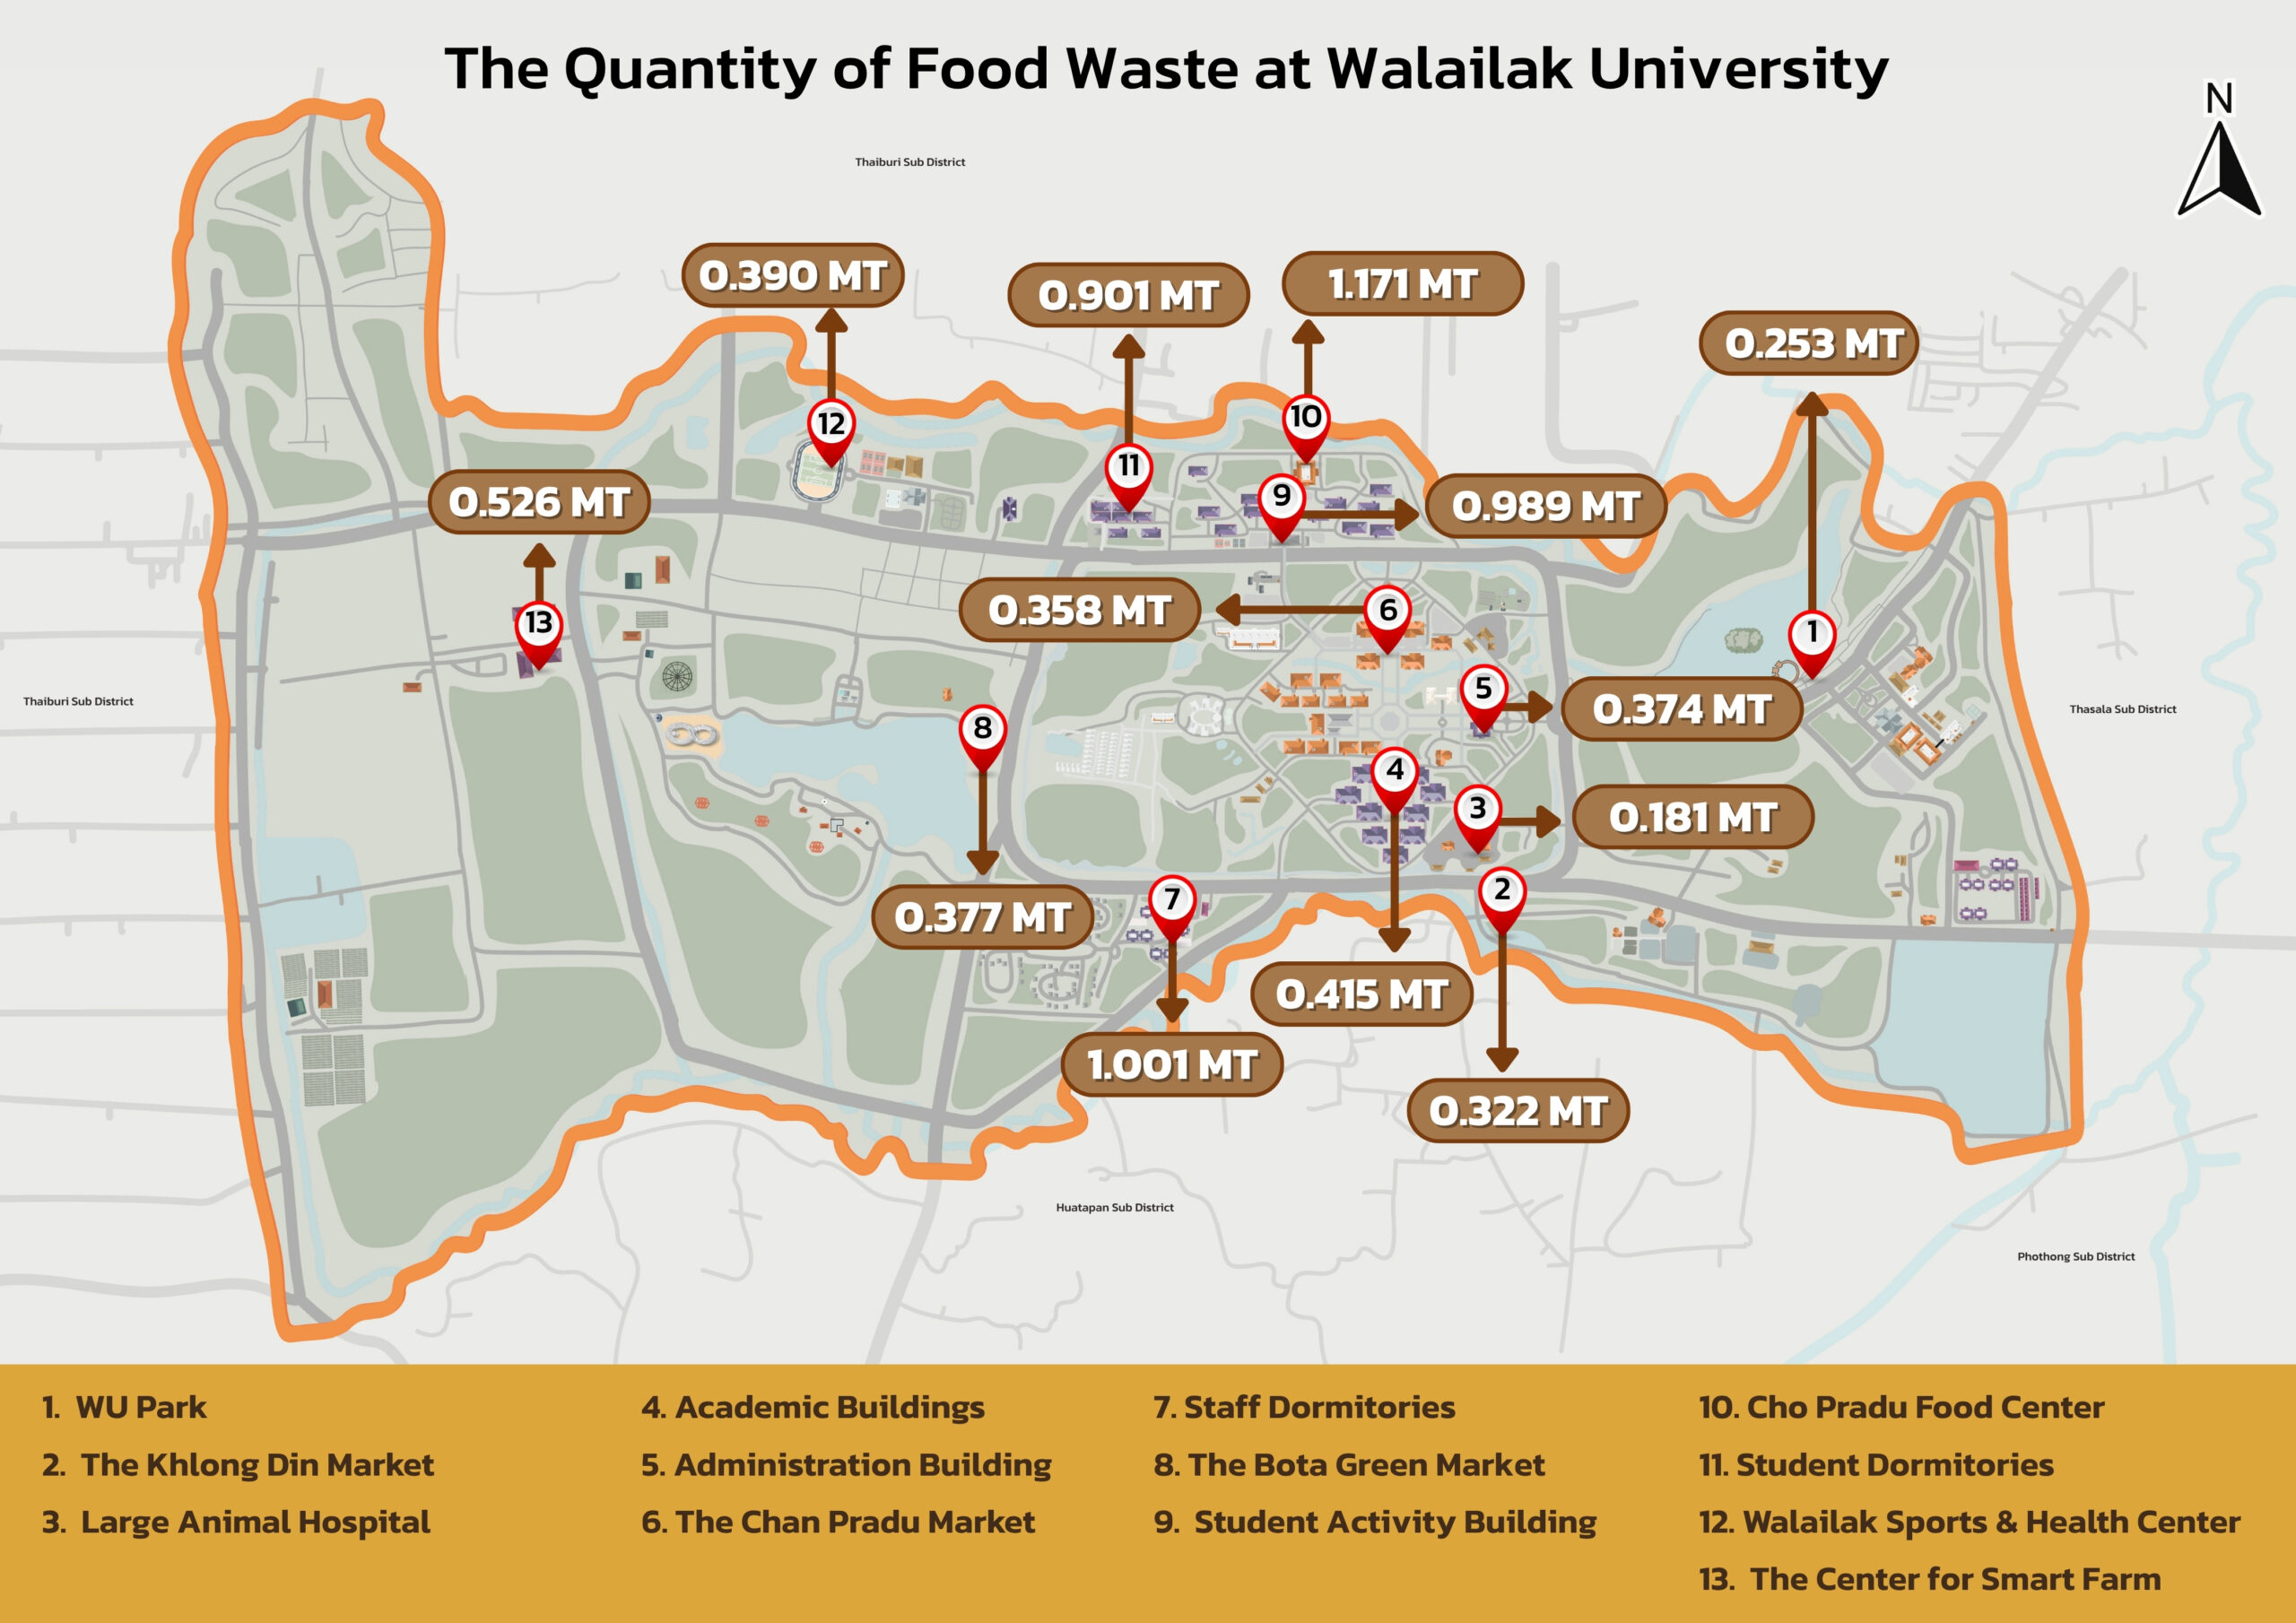
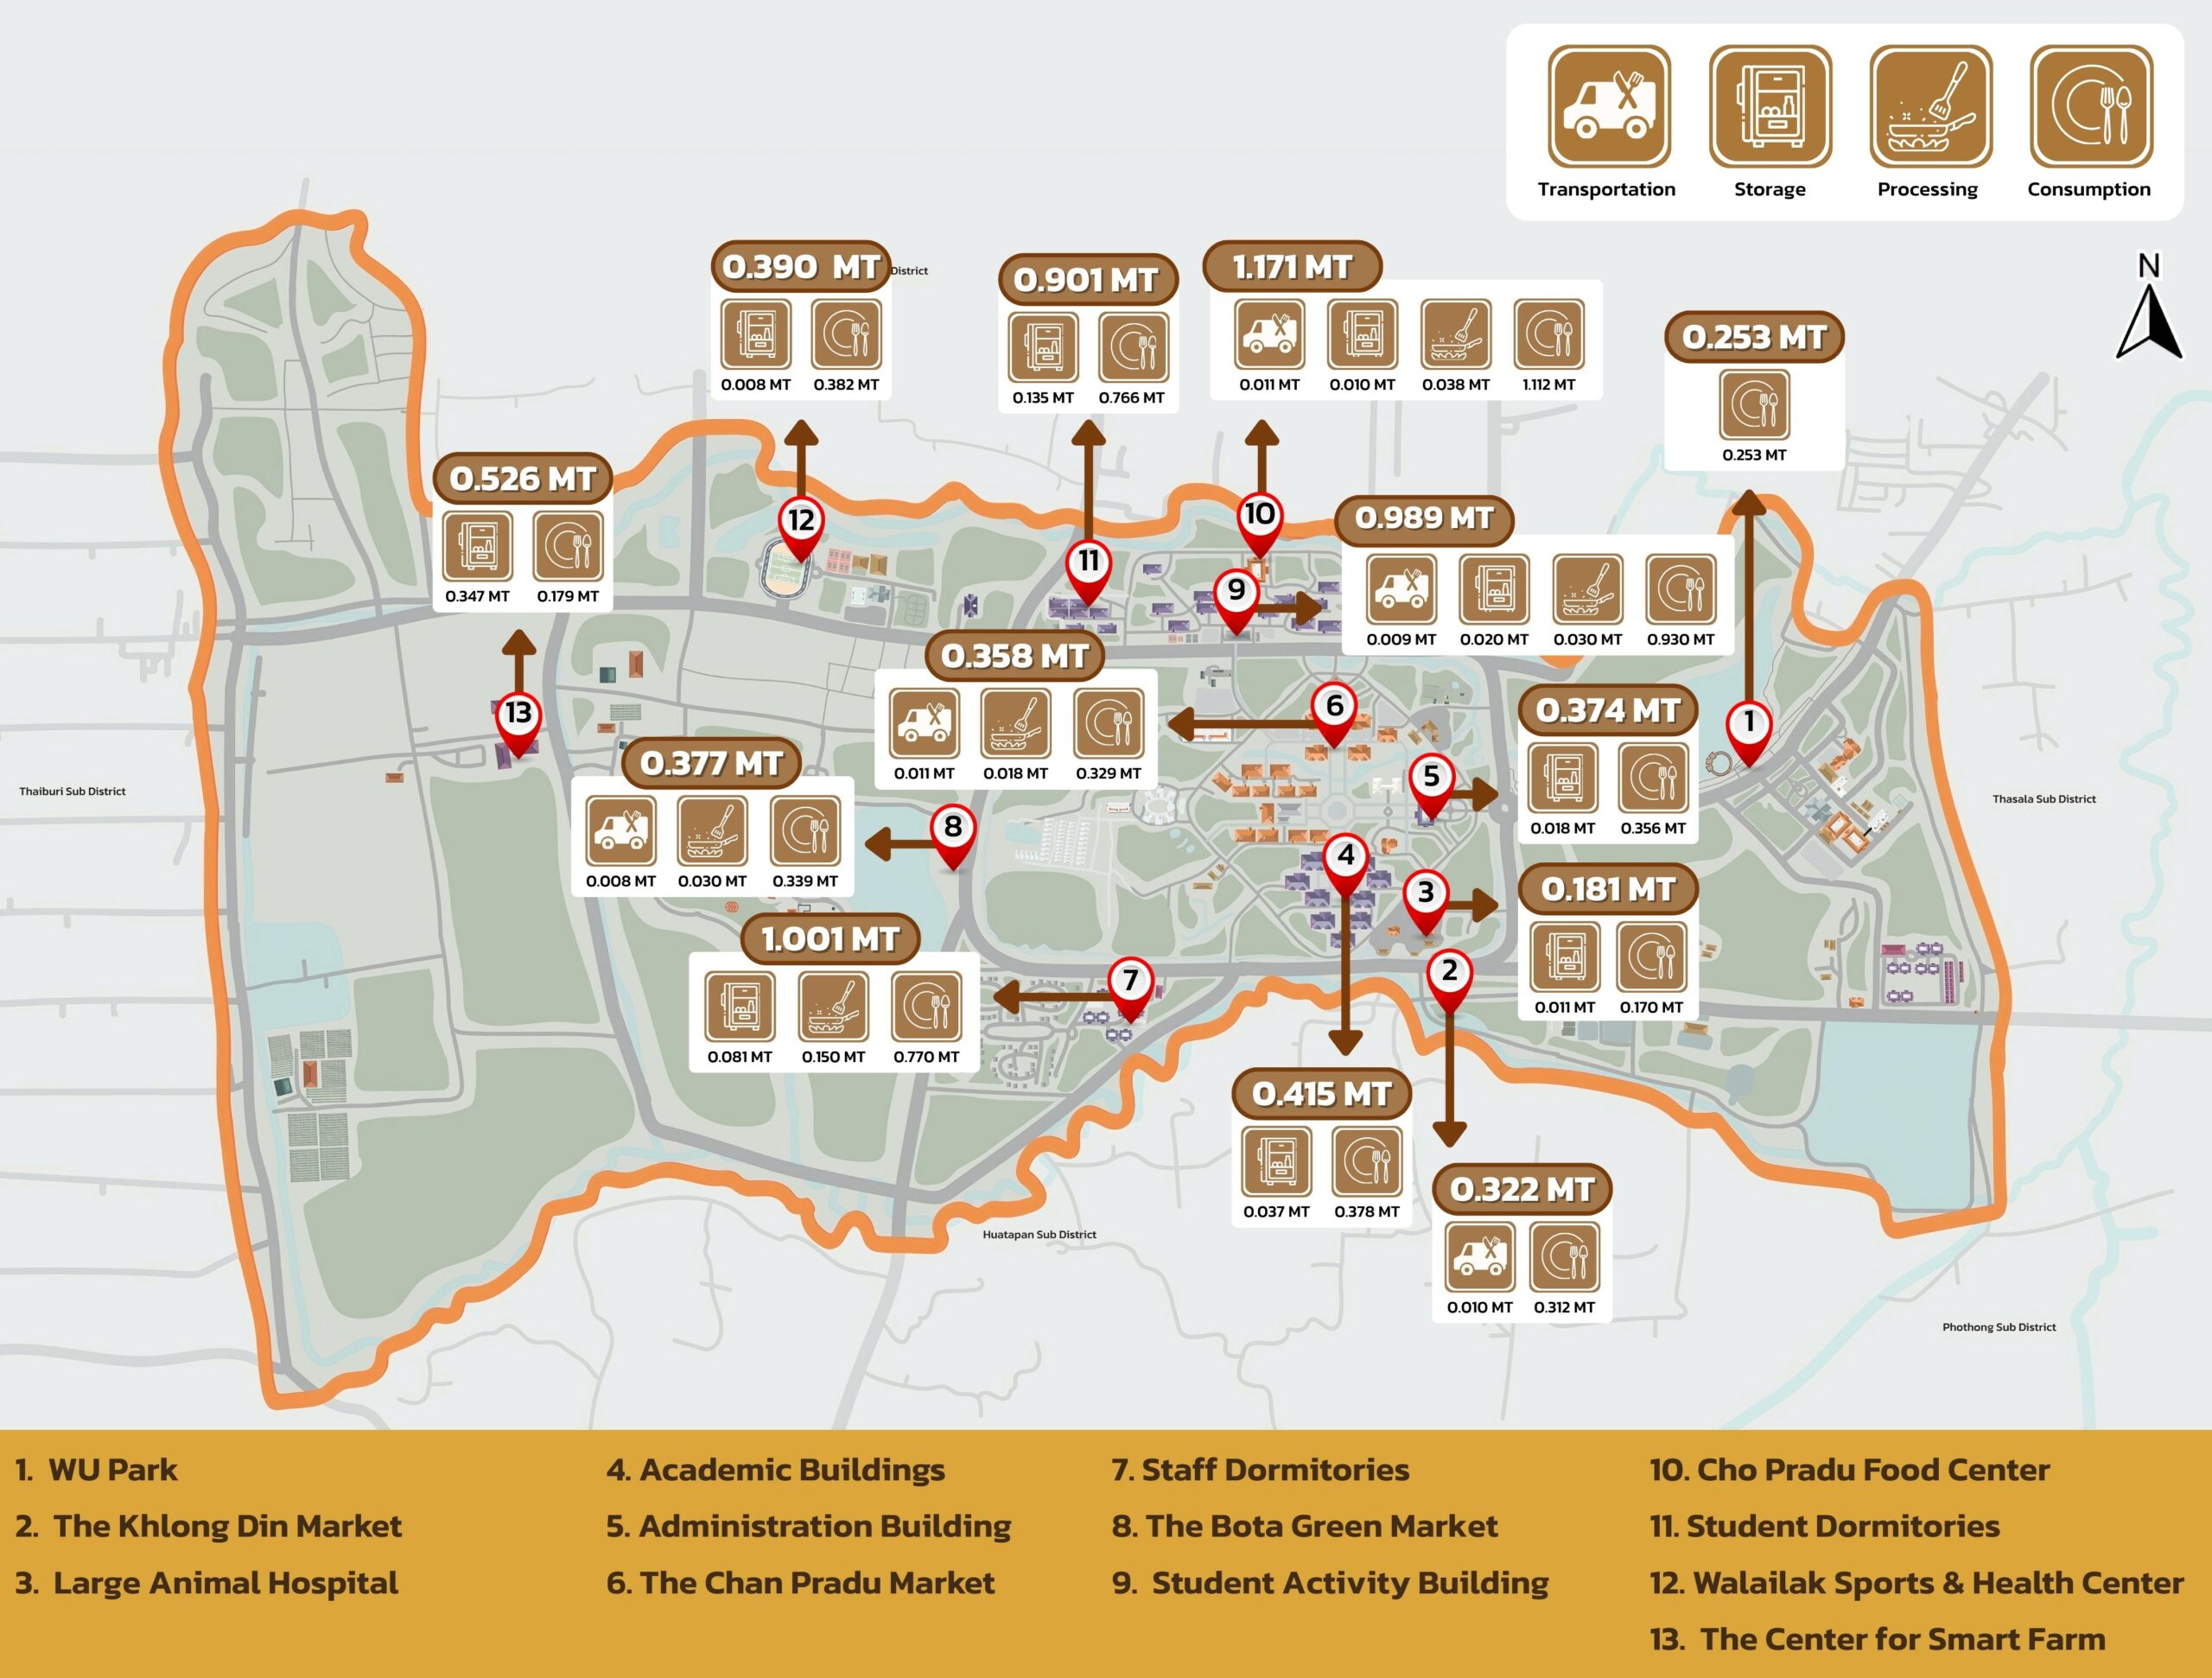
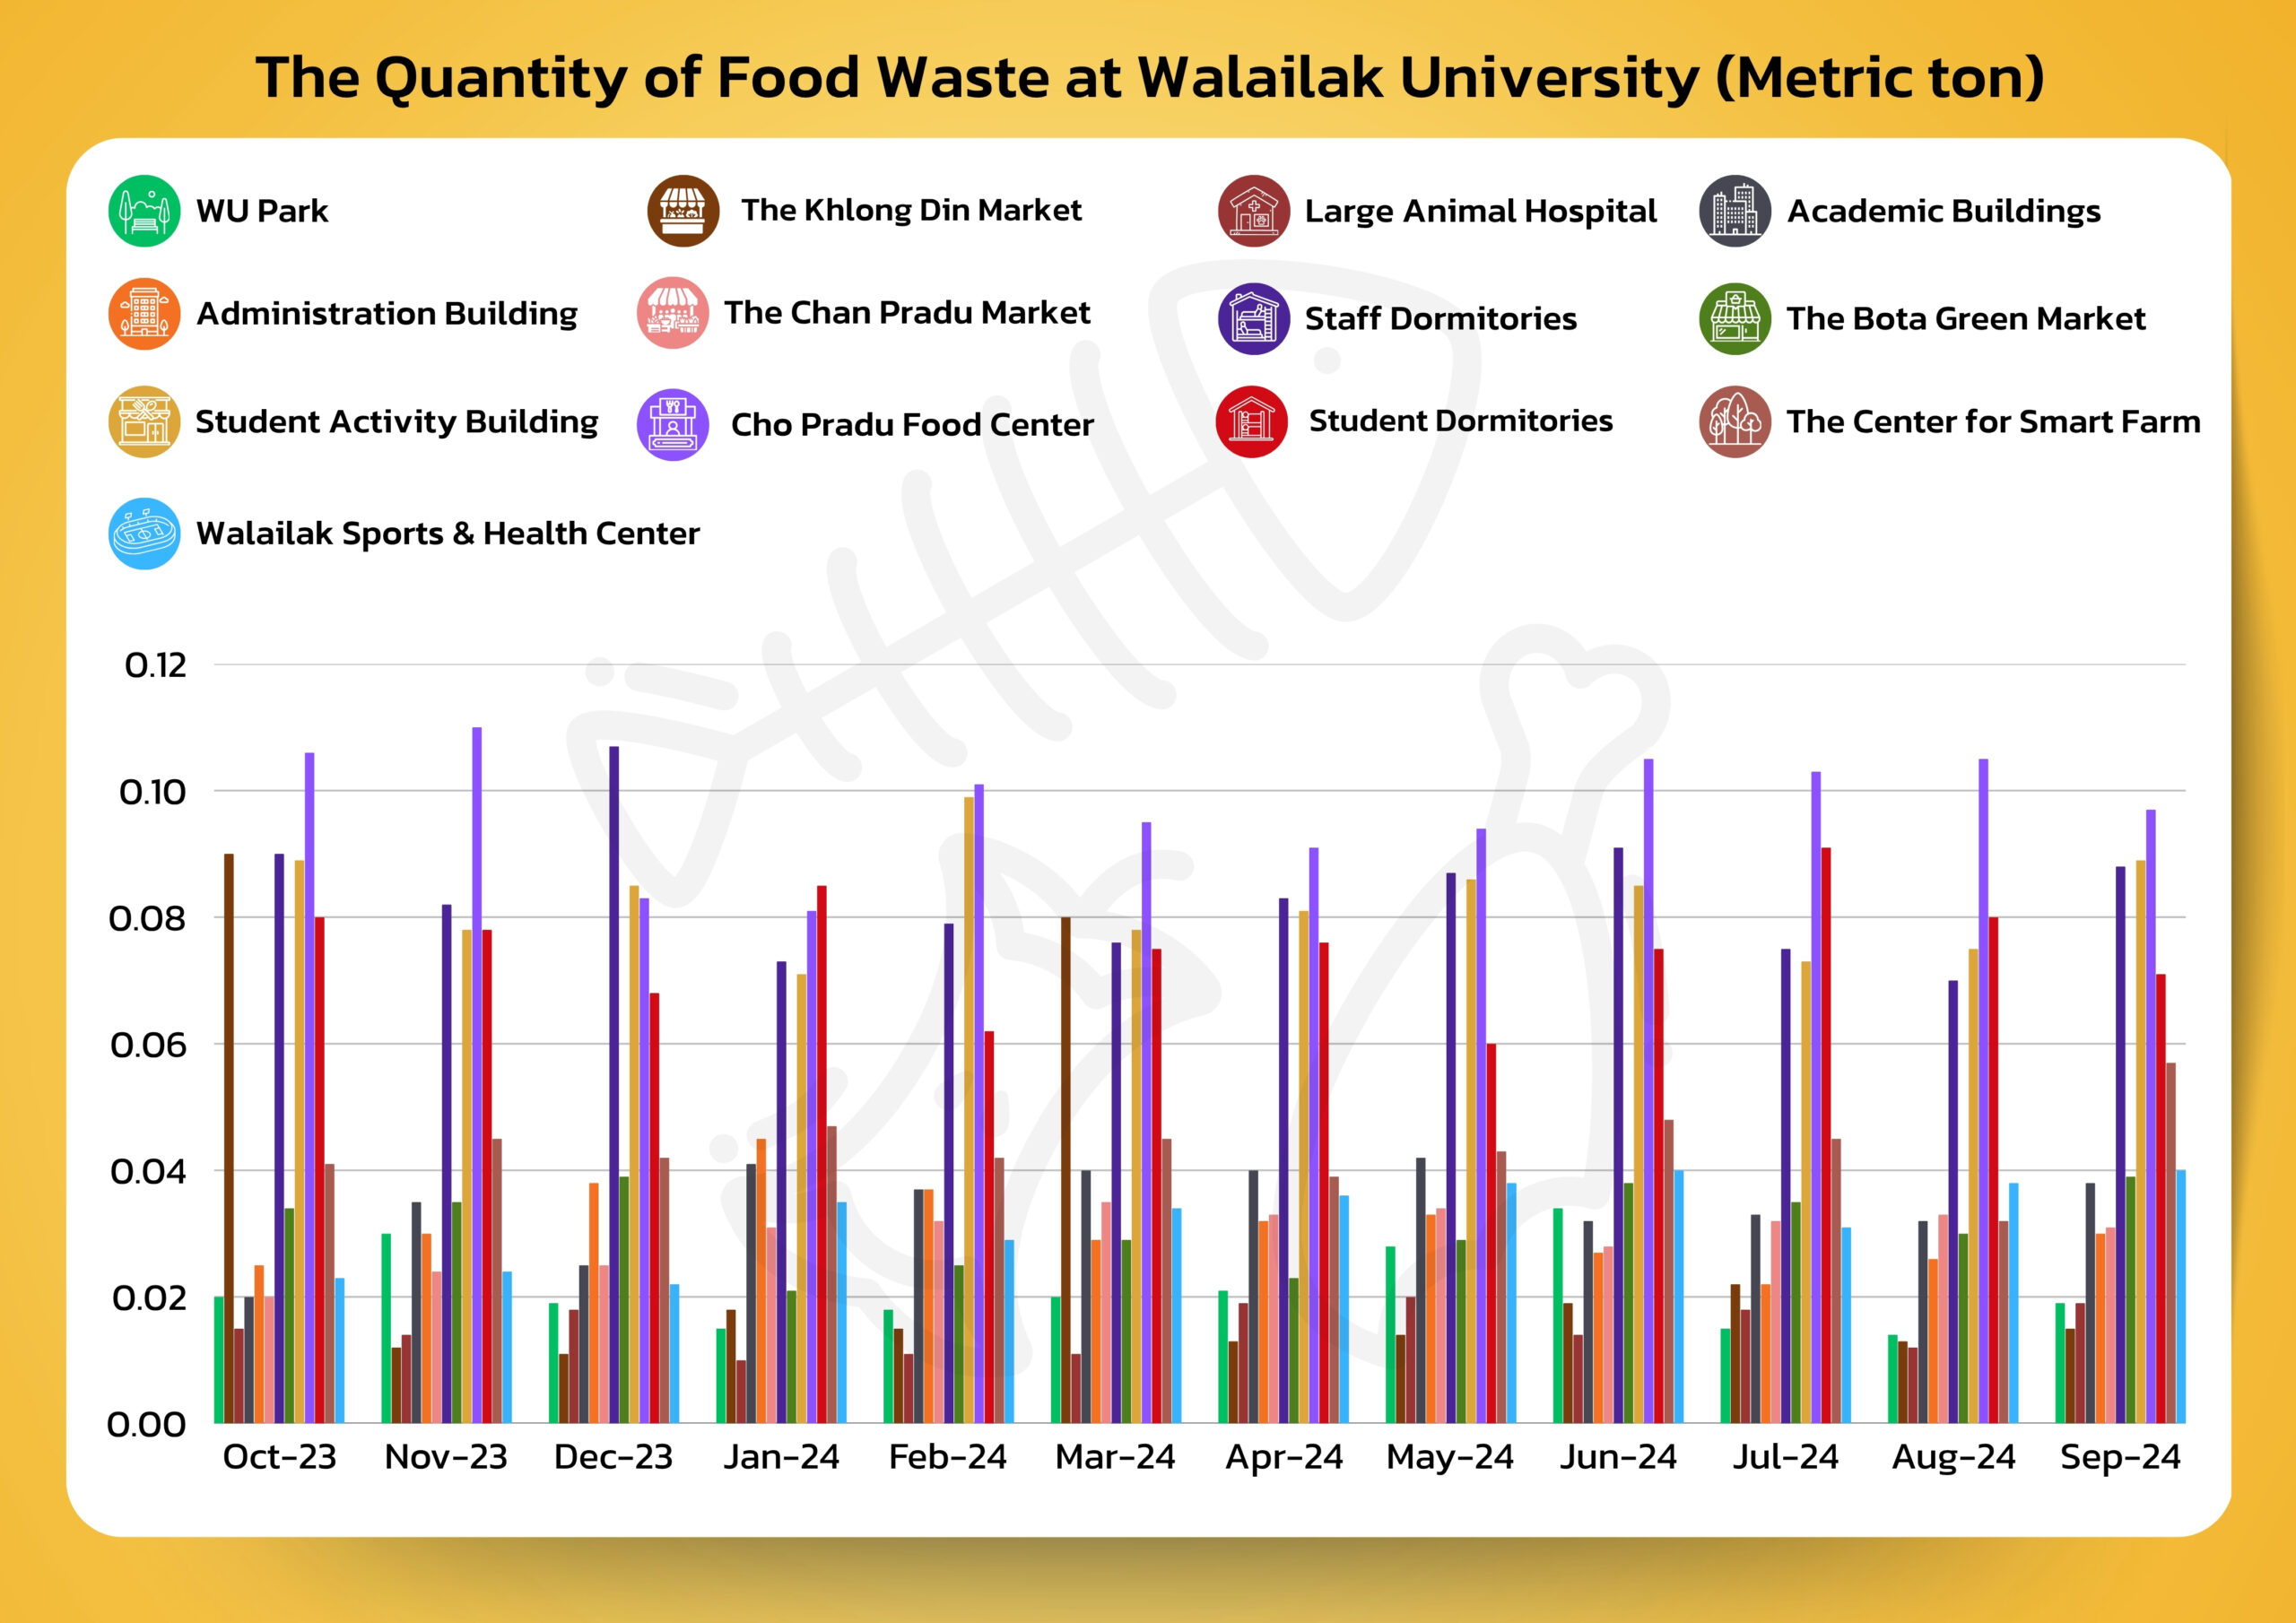
In 2024, the Center for Smart Farming and Landscape Architecture measured the amount of food waste generated from food served within the university across the whole university. Data were continuously recorded throughout the fiscal year, revealing that the total amount of food waste within the university amounted to 7.258 metric tons.
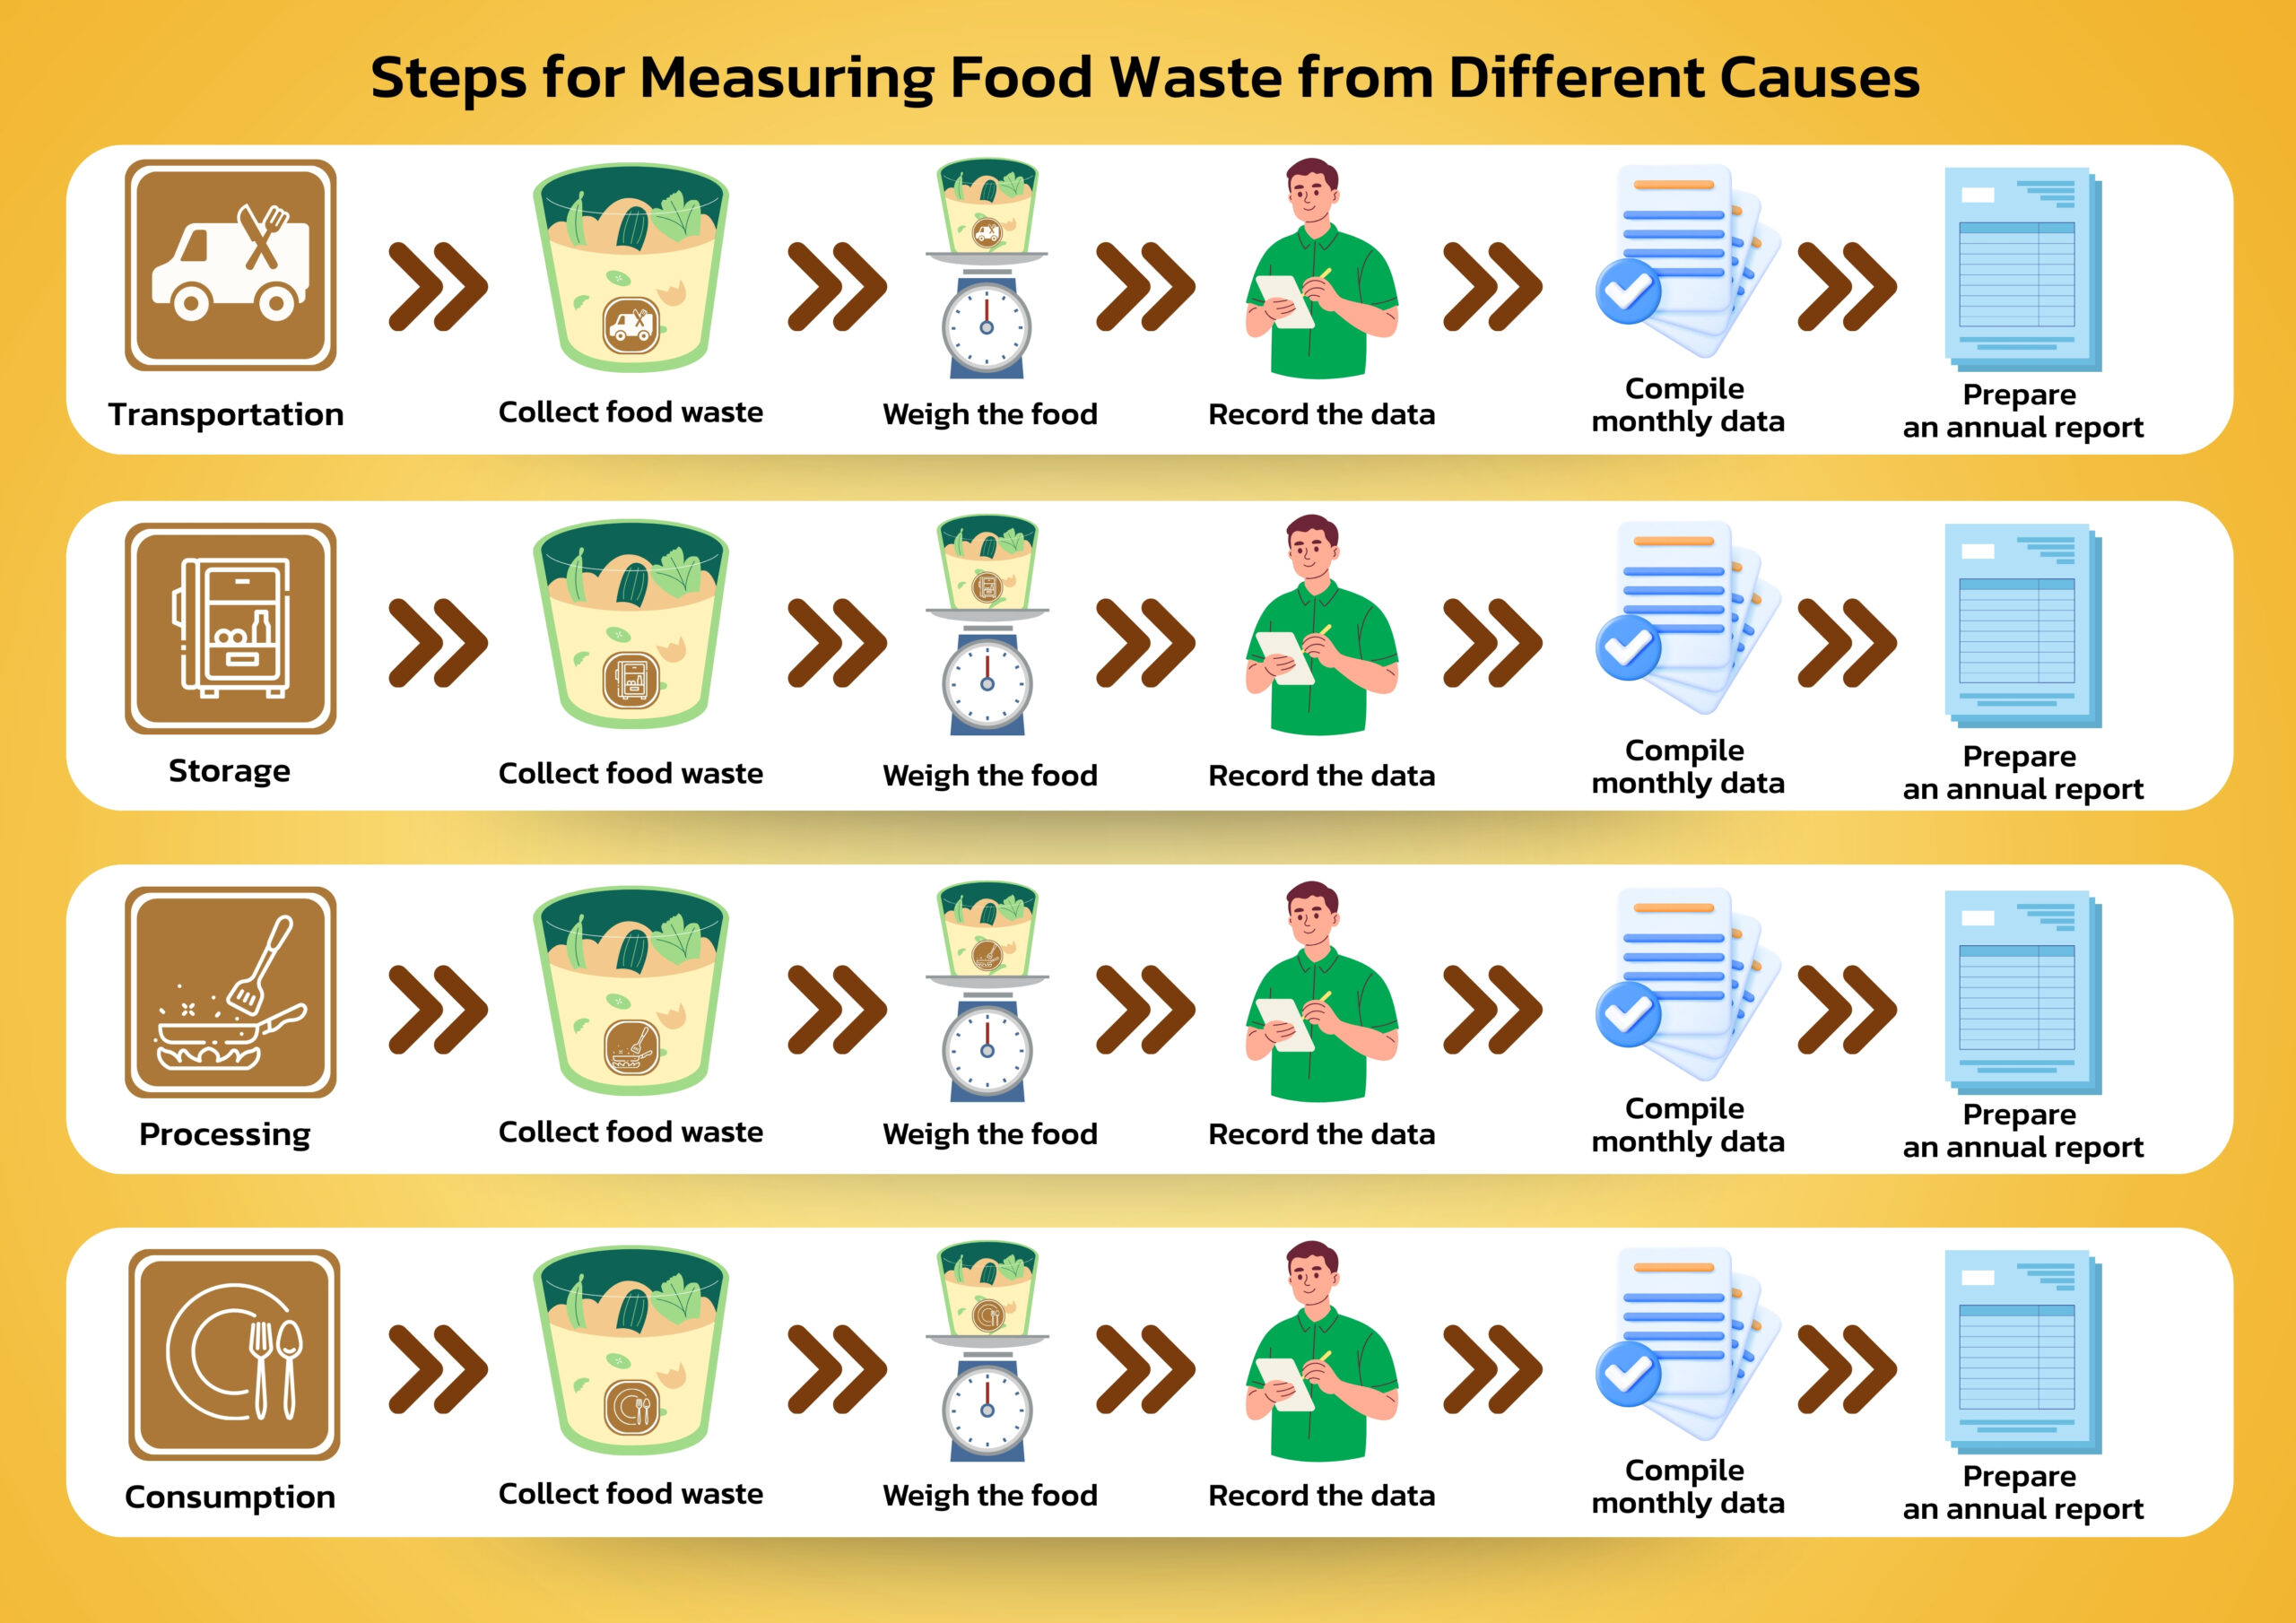
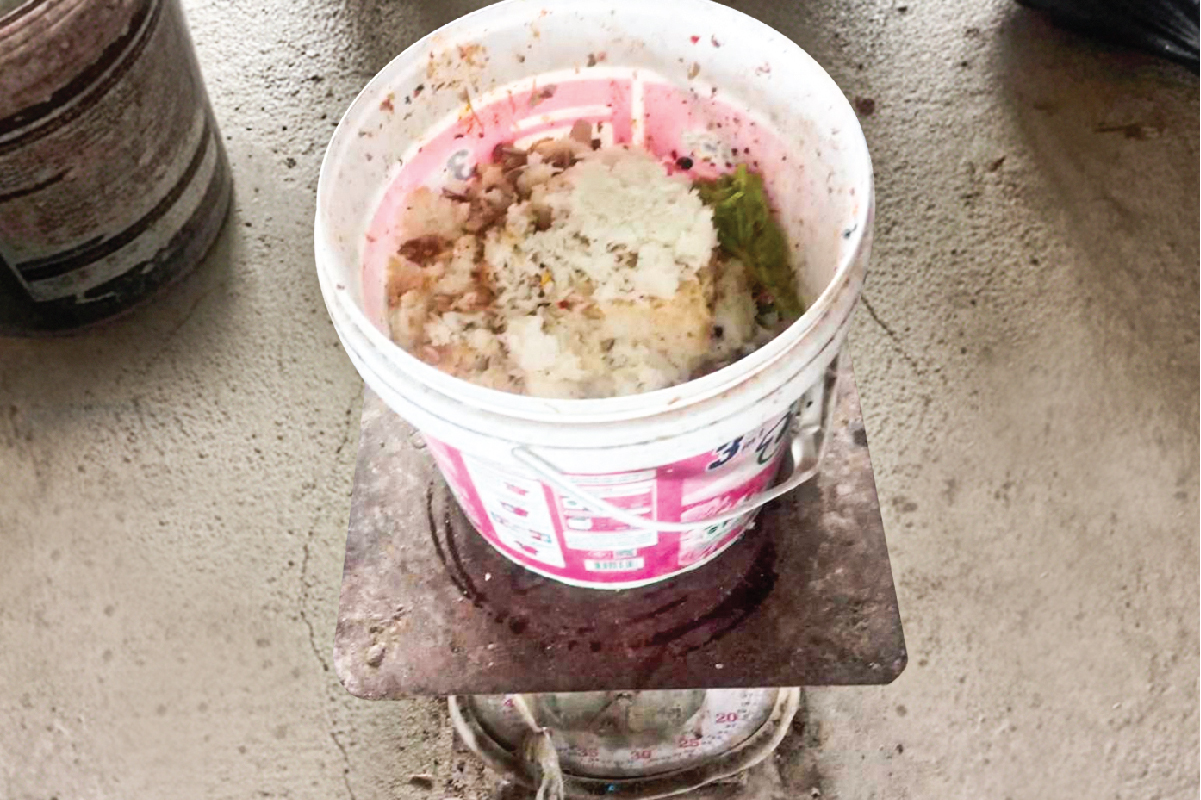
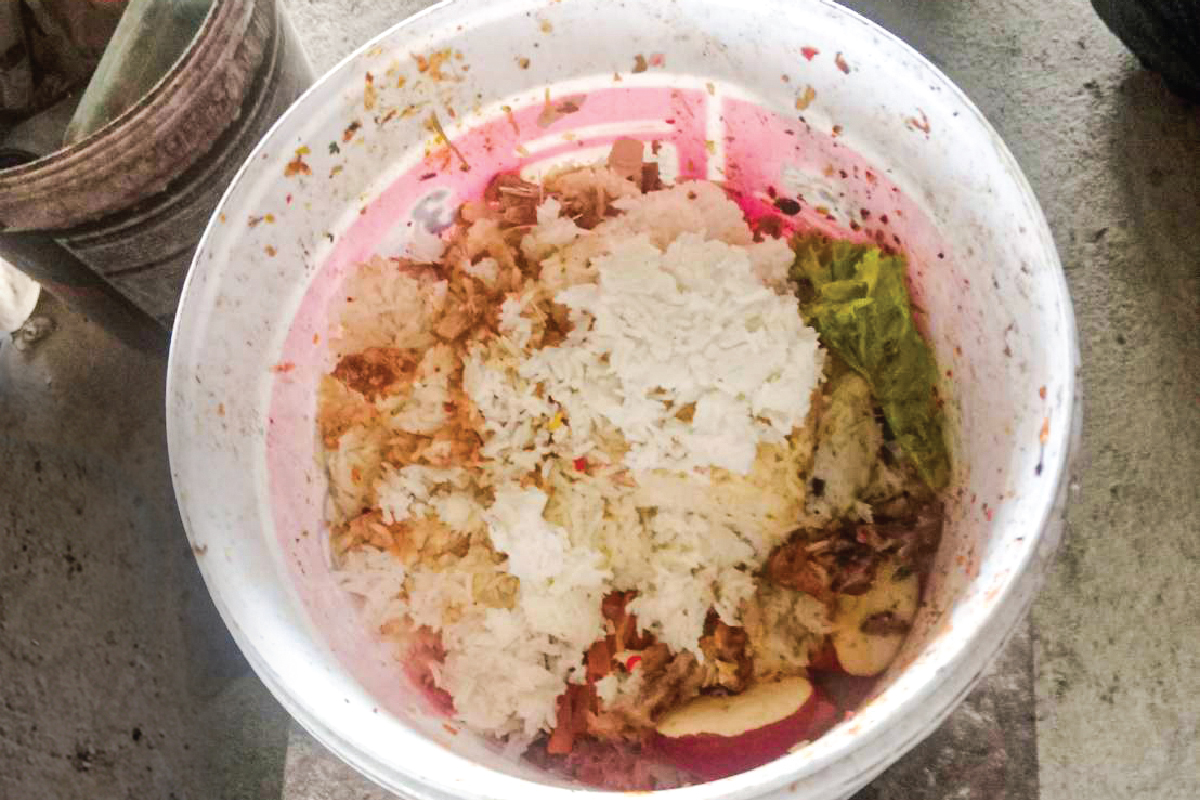
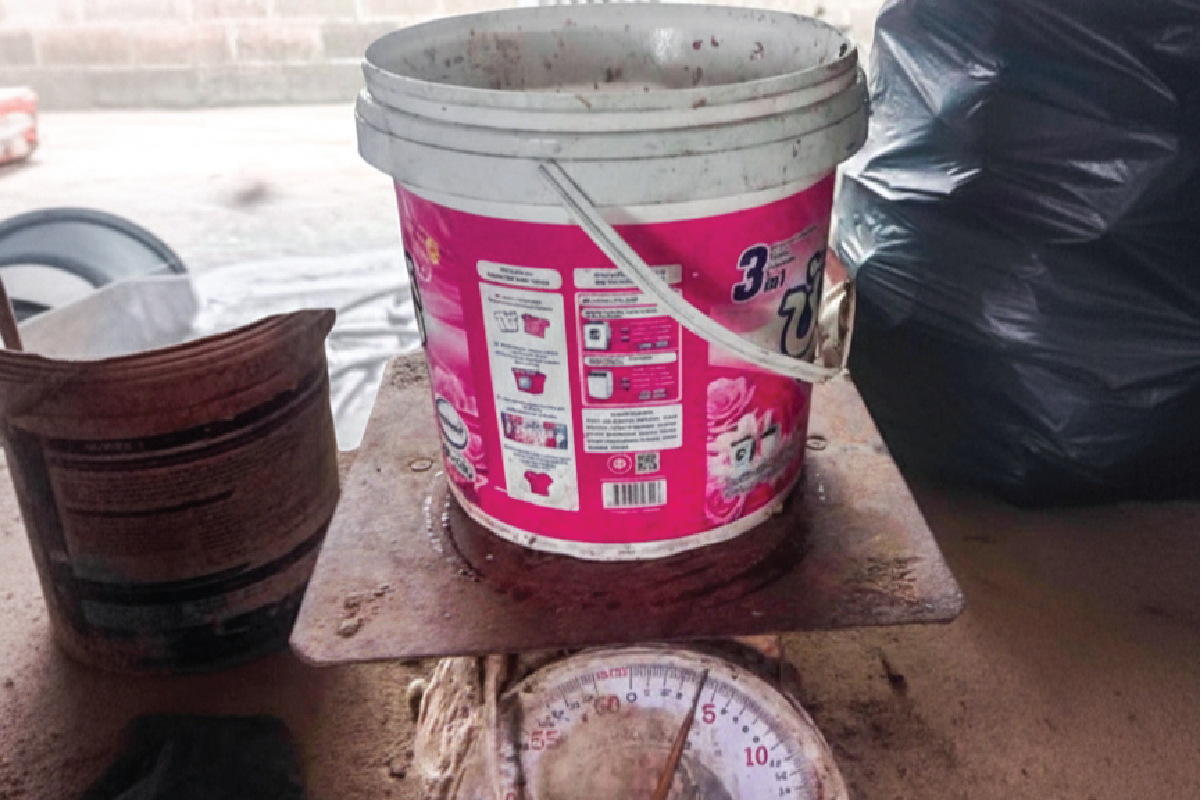
Data are collected through daily weighing and recording of food waste, categorized into four main causes: transportation, storage, processing, and consumption. The daily records are then compiled and summarized into monthly reports.
The number of amount of food waste generated from food served within the university was compiled from 13 key areas covering the whole campus, including:
WU Park
The Khlong Din Market
Large Animal Hospital
Academic Buildings
Administration Building
The Chan Pradu Market
Staff Dormitories
The Bota Green Market
Student Activity Building Food Center
Cho Pradu Food Center
Student Dormitories
Walailak Sports & Health Center
The Center for Smart Farm
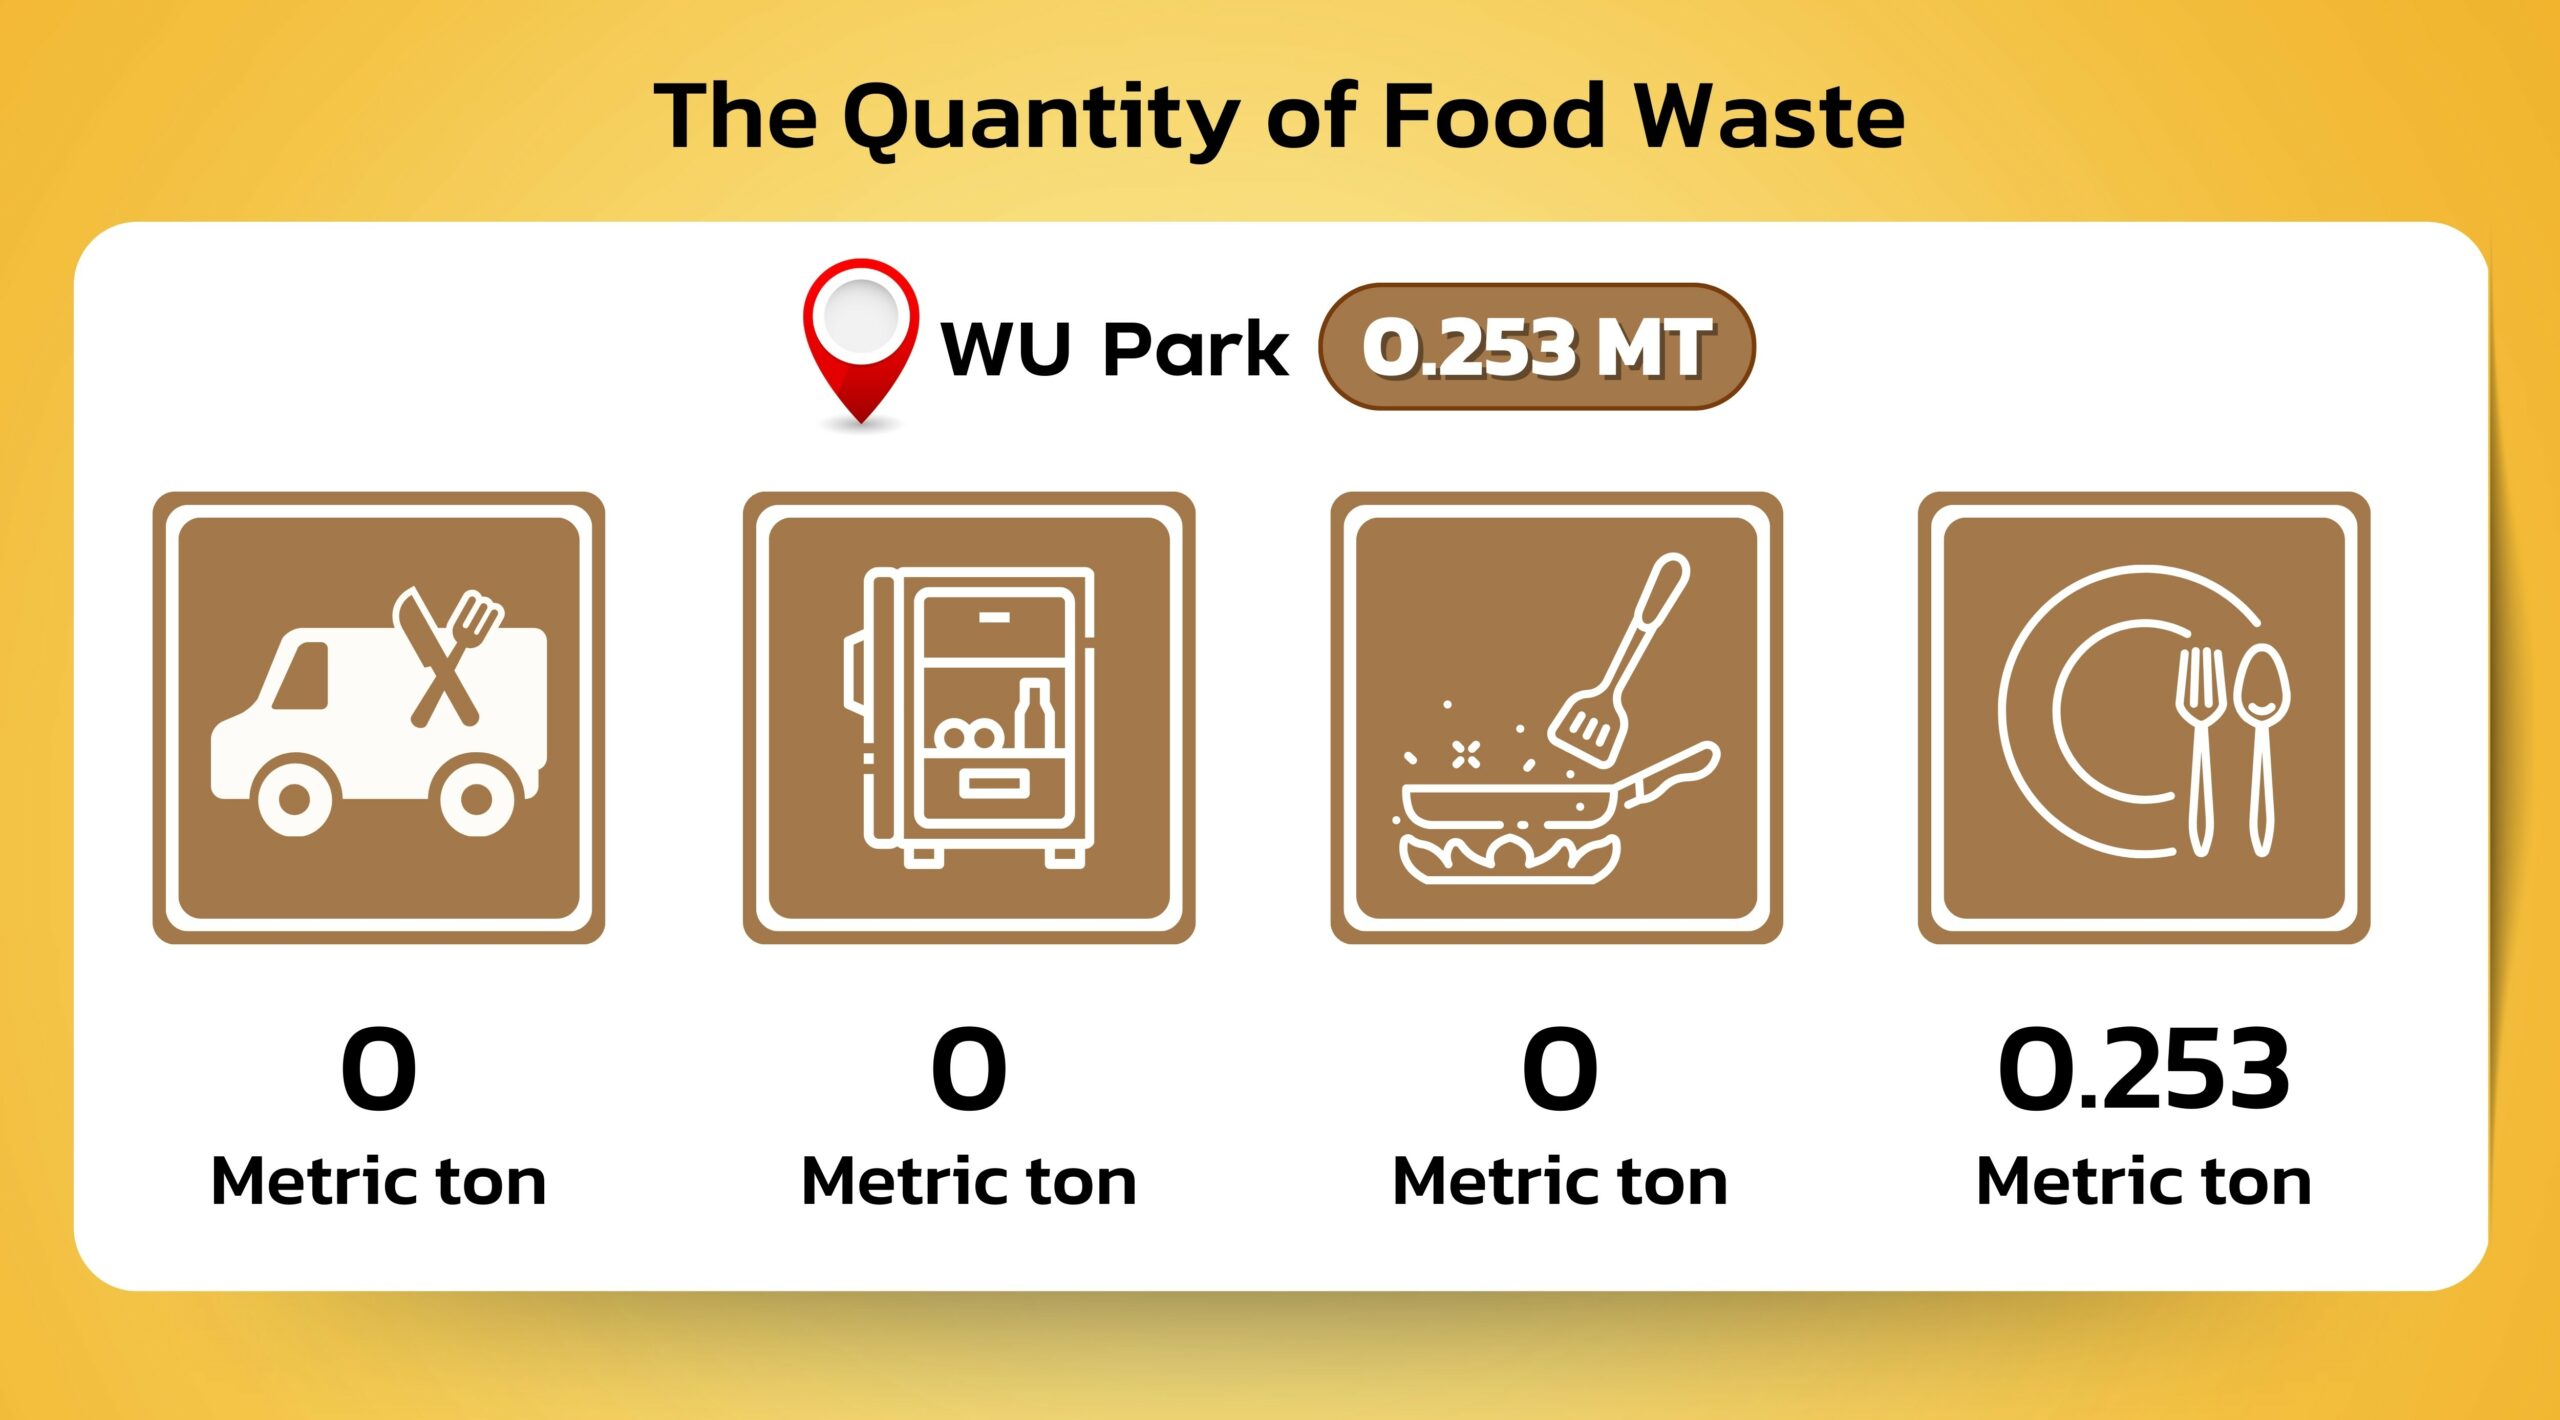
WU Park
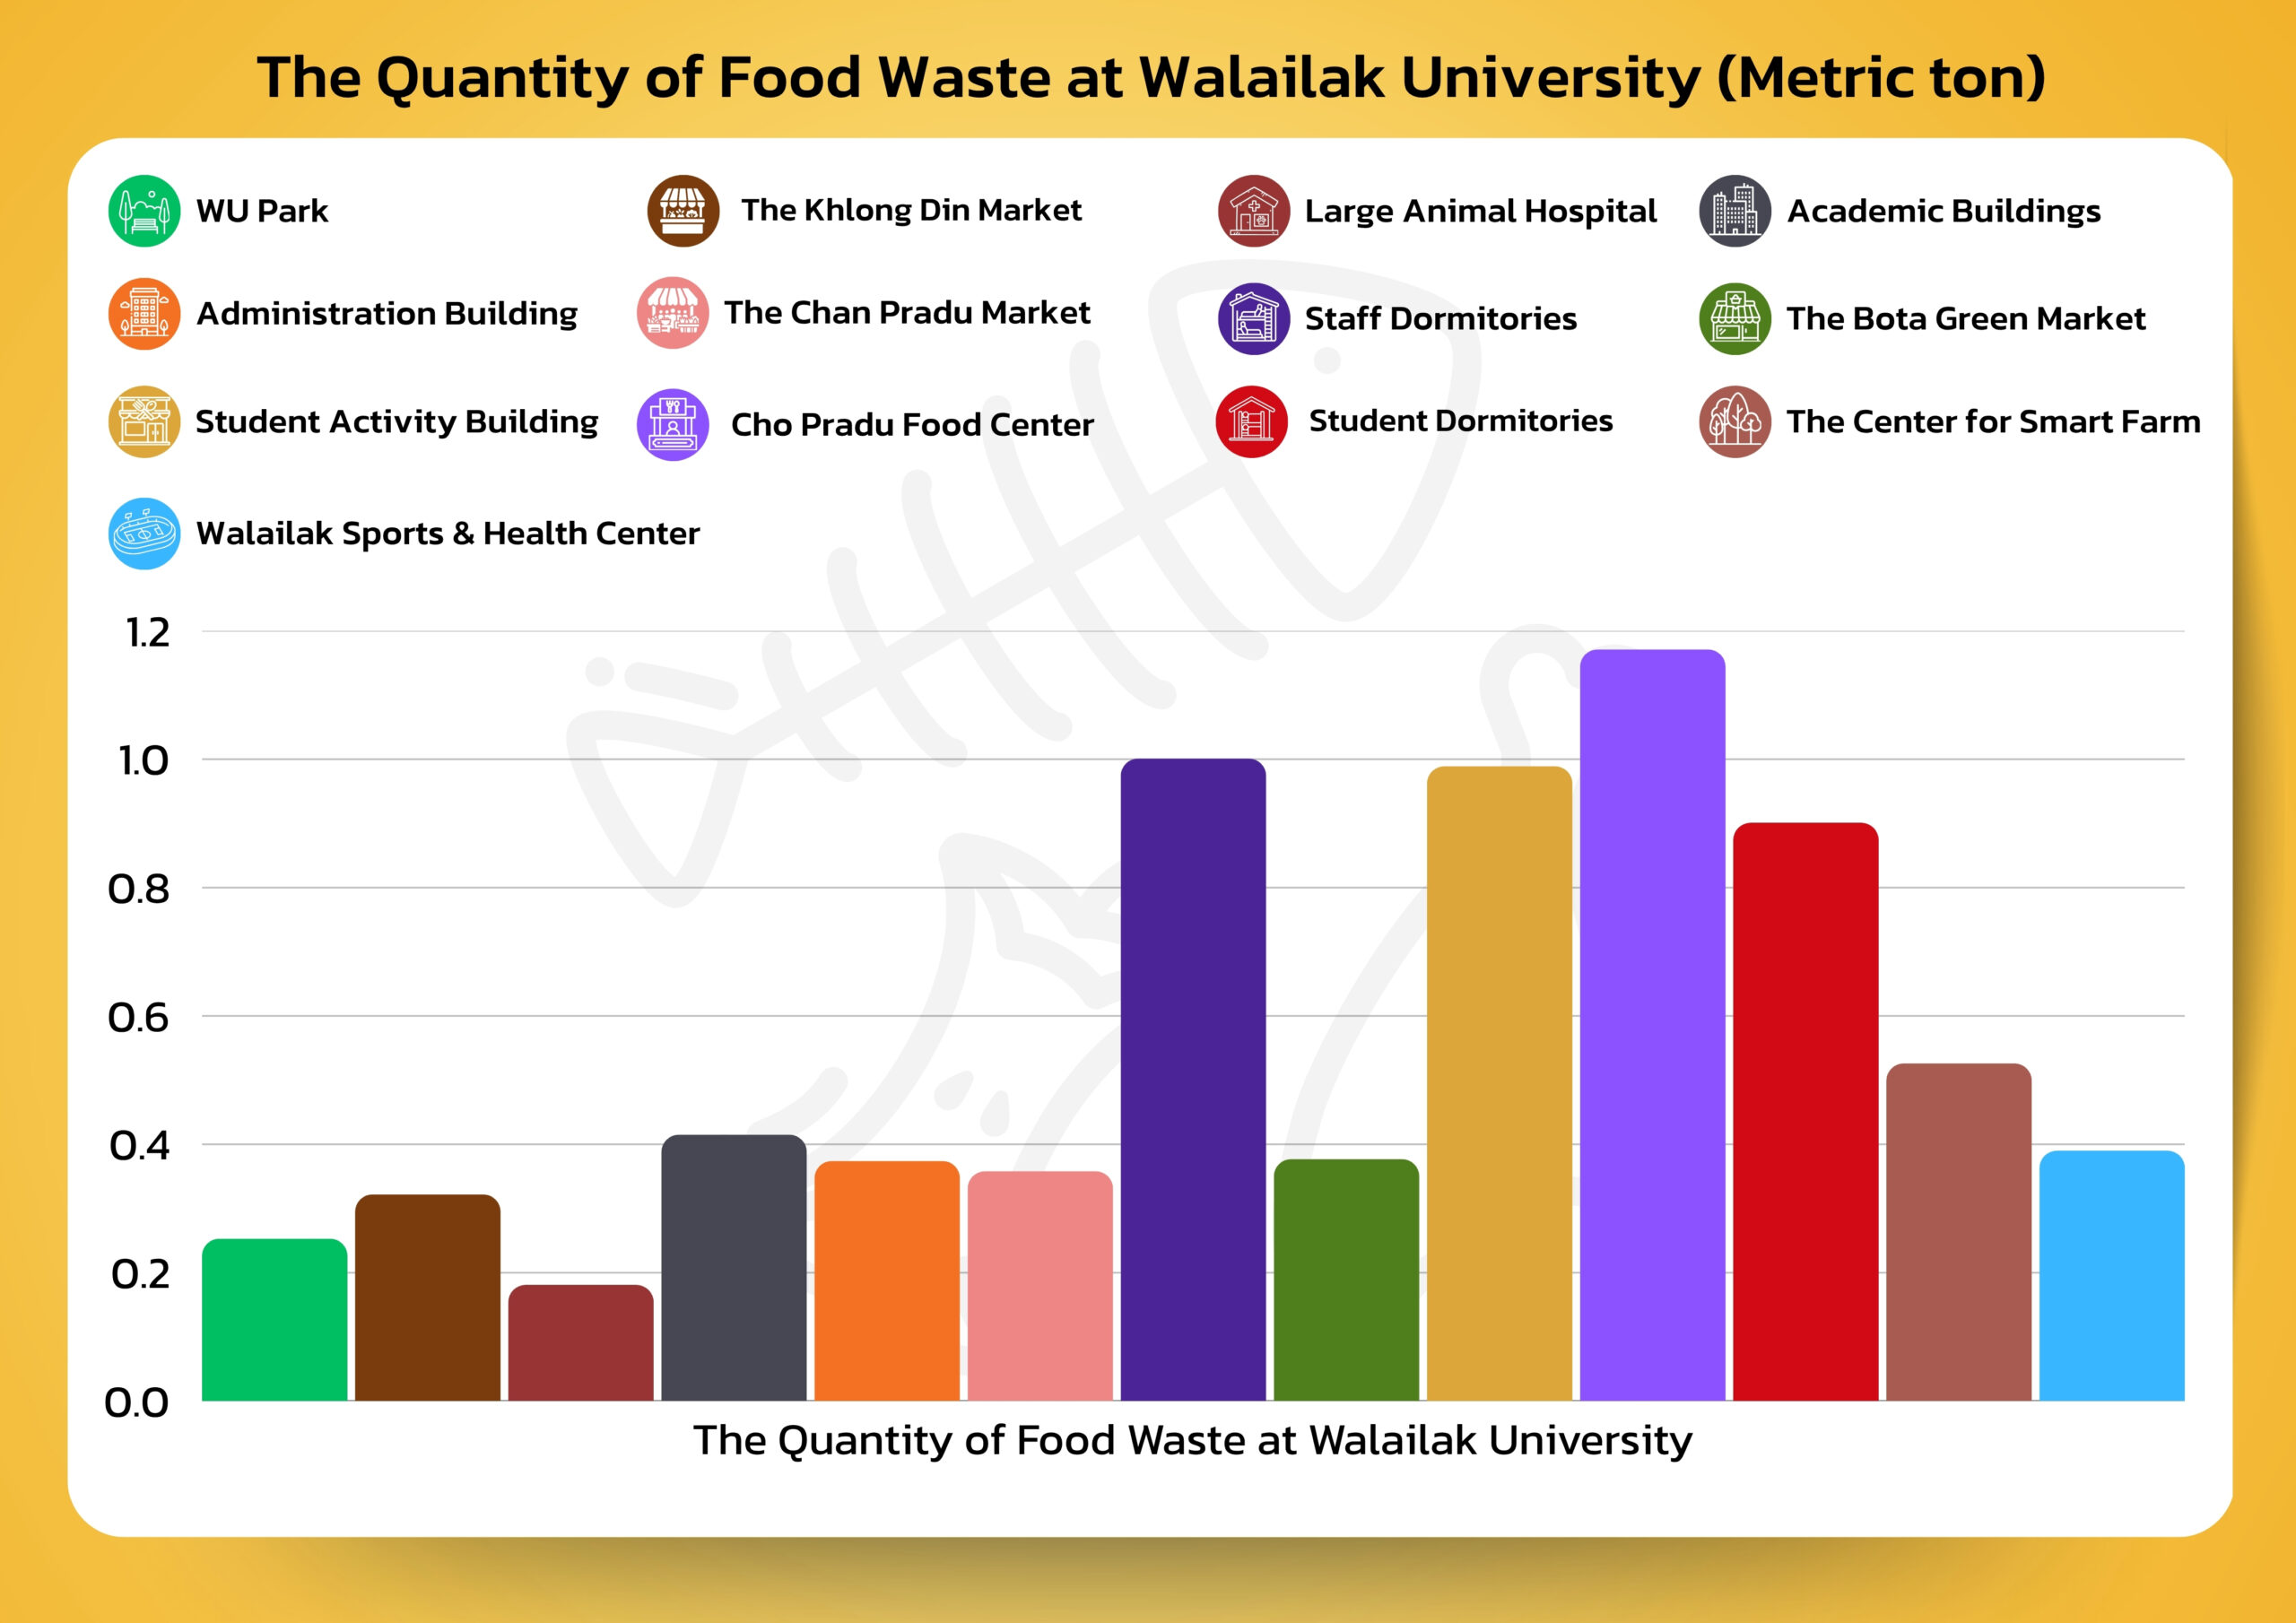
WU Park generated a total of 0.253 metric ton of food waste, all of which came from consumption (100%). This indicates that the food waste problem in this area stems entirely from user behavior, with no losses from transportation or storage.
The Khlong Din Market
The Khlong Din Market produced 0.322 metric ton of food waste, mainly from consumption at 0.312 metric ton (96.89%) and a small amount from transportation at 0.010 metric ton (3.11%). This reflects that the primary cause of food waste here is leftovers from consumption.
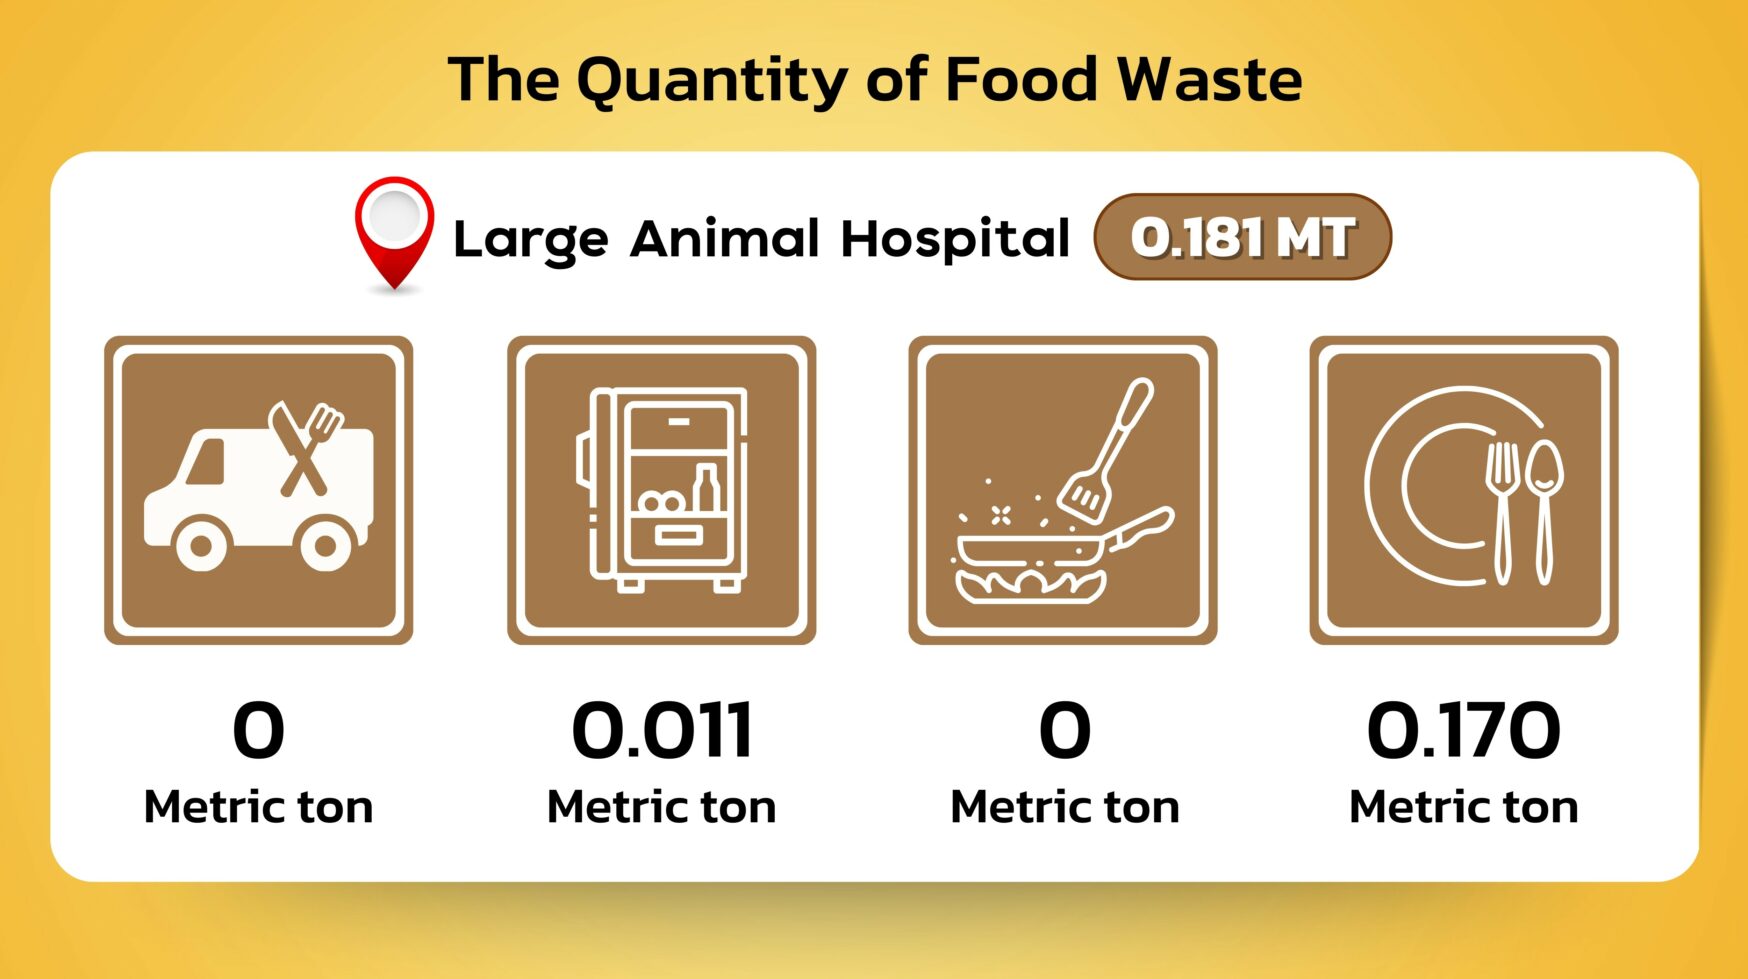
Large Animal Hospital
The Large Animal Hospital generated 0.181 metric ton of food waste, primarily from consumption at 0.170 metric ton (93.92%) and storage at 0.011 metric ton (6.08%). This indicates that, aside from consumption, improper storage practices also contribute to food waste.
Academic Buildings
Academic Buildings produced 0.415 metric ton of food waste, with consumption accounting for 0.378 metric ton (91.08%) and storage 0.037 metric ton (8.92%). This highlights relatively higher storage-related losses compared to other areas.
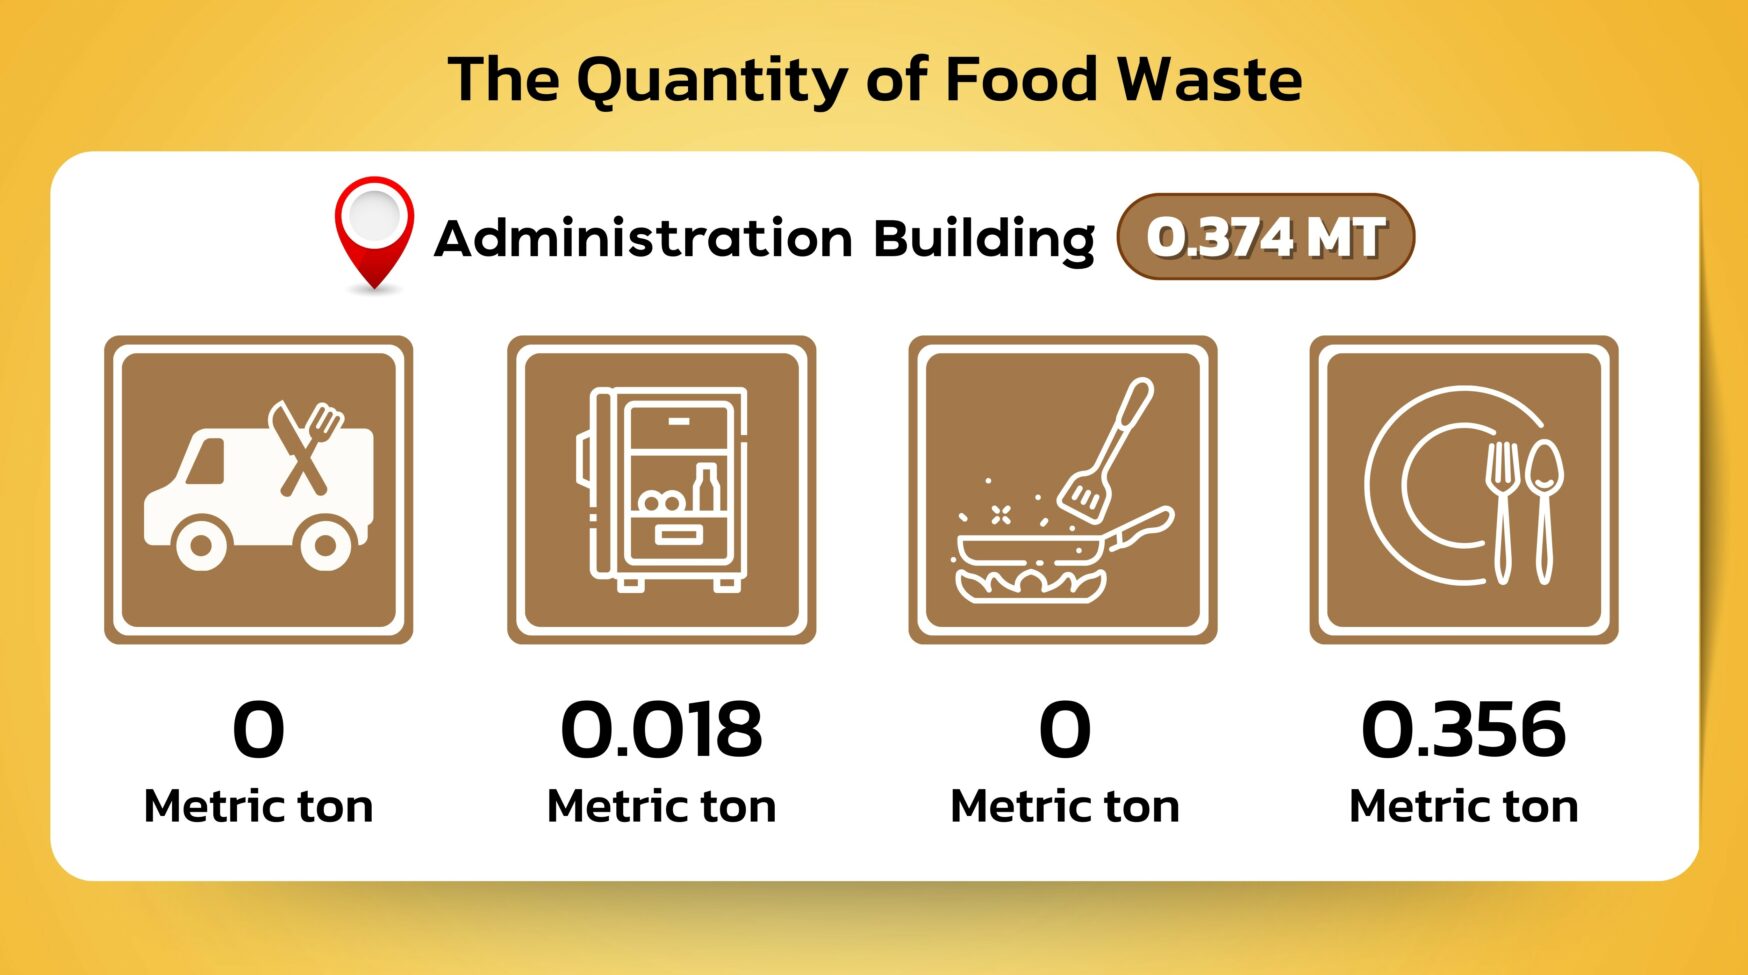
Administrative Building
The Administrative Building generated 0.374 metric ton of food waste, mainly from consumption at 0.356 metric ton (95.19%) and storage at 0.018 metric ton (4.81%).
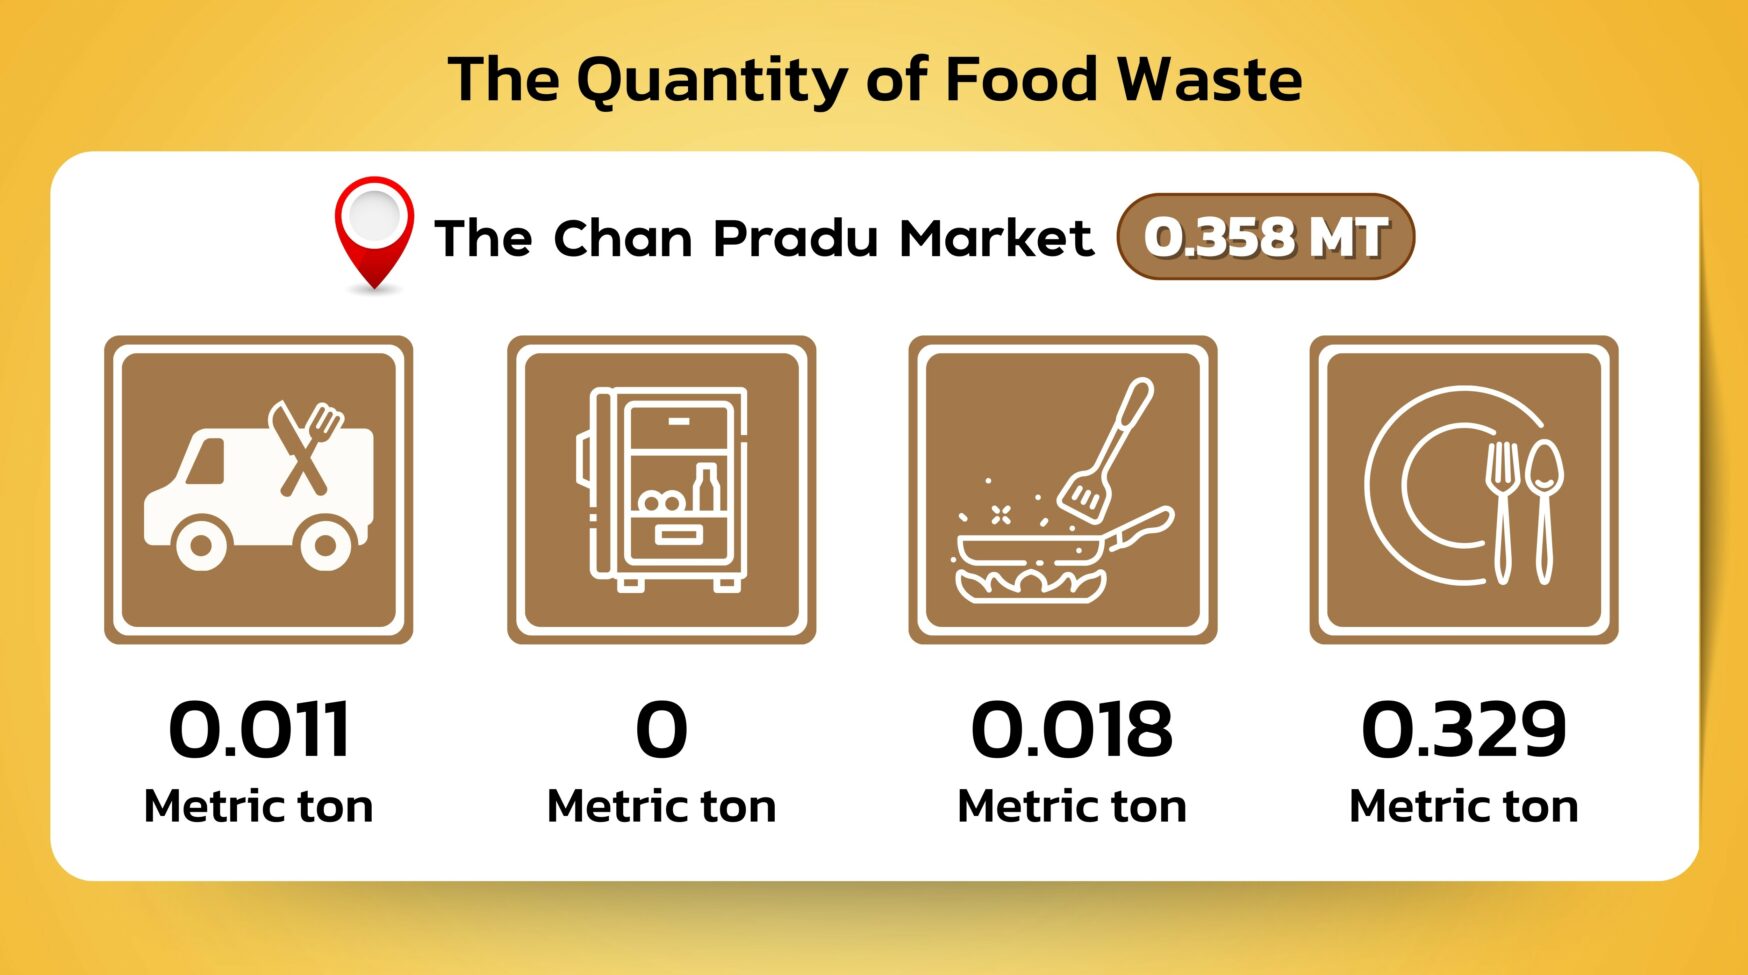
The Chan Pradu Market
The Chan Pradu Market produced 0.358 metric ton of food waste, with consumption contributing 0.329 metric ton (91.90%), processing 0.018 metric ton (5.03%), and transportation 0.011 metric ton (3.07%). This shows that food waste in this market arises from multiple sources.
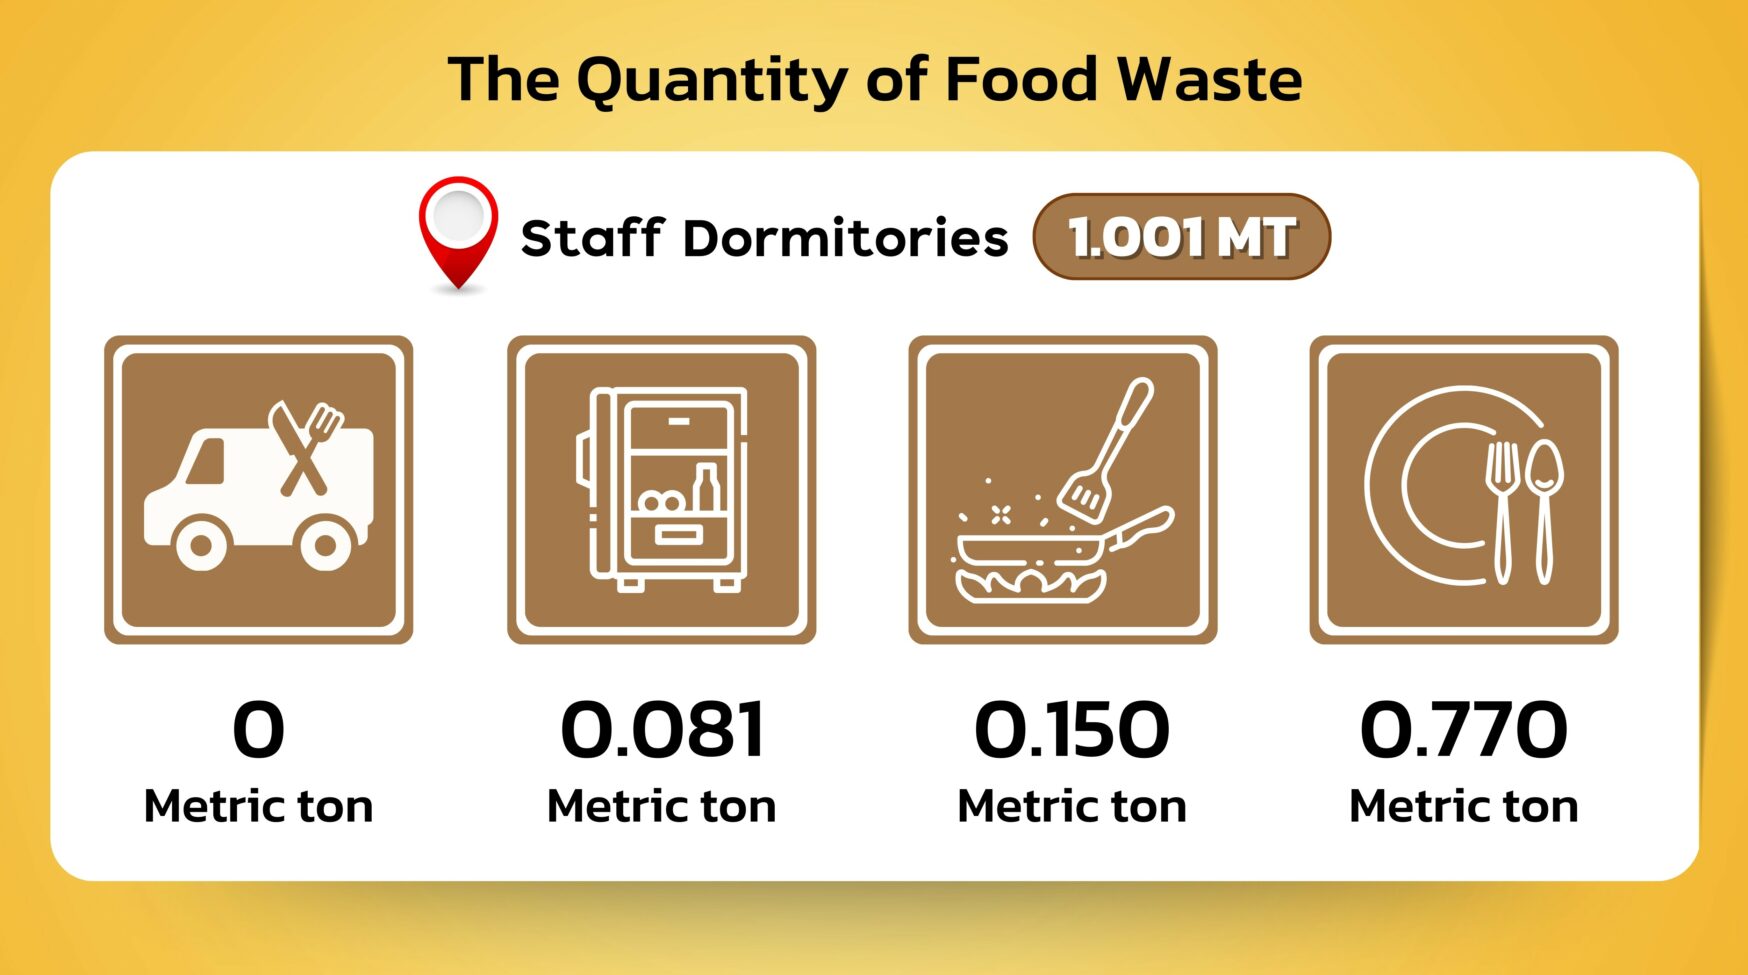
Staff Dormitories
Staff Dormitories generated 1.001 metric tons of food waste, with consumption at 0.770 metric ton (76.92%), processing at 0.150 metric ton (14.99%), and storage at 0.081 metric ton (8.09%). This indicates clear issues both in food preparation and storage practices.
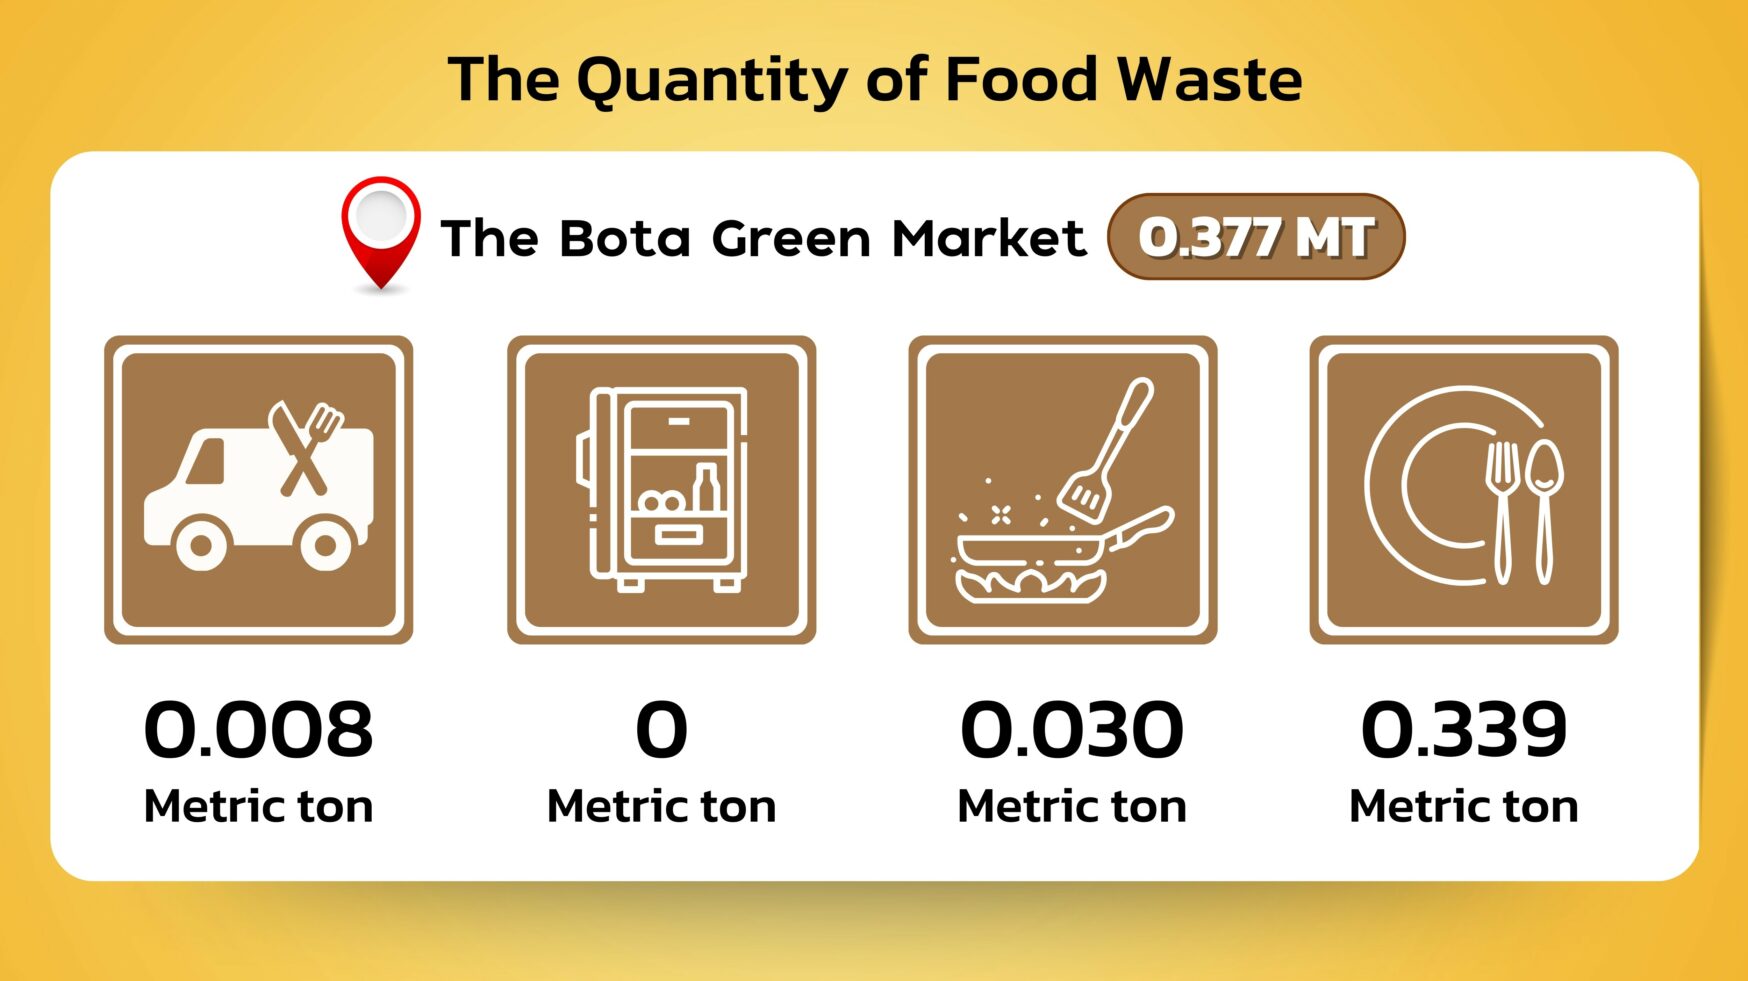
The Bota Green Market
The Bota Green Market produced 0.377 metric ton of food waste, mostly from consumption at 0.339 metric ton (89.92%), followed by processing at 0.030 metric ton (7.96%) and transportation at 0.008 metric ton (2.12%).
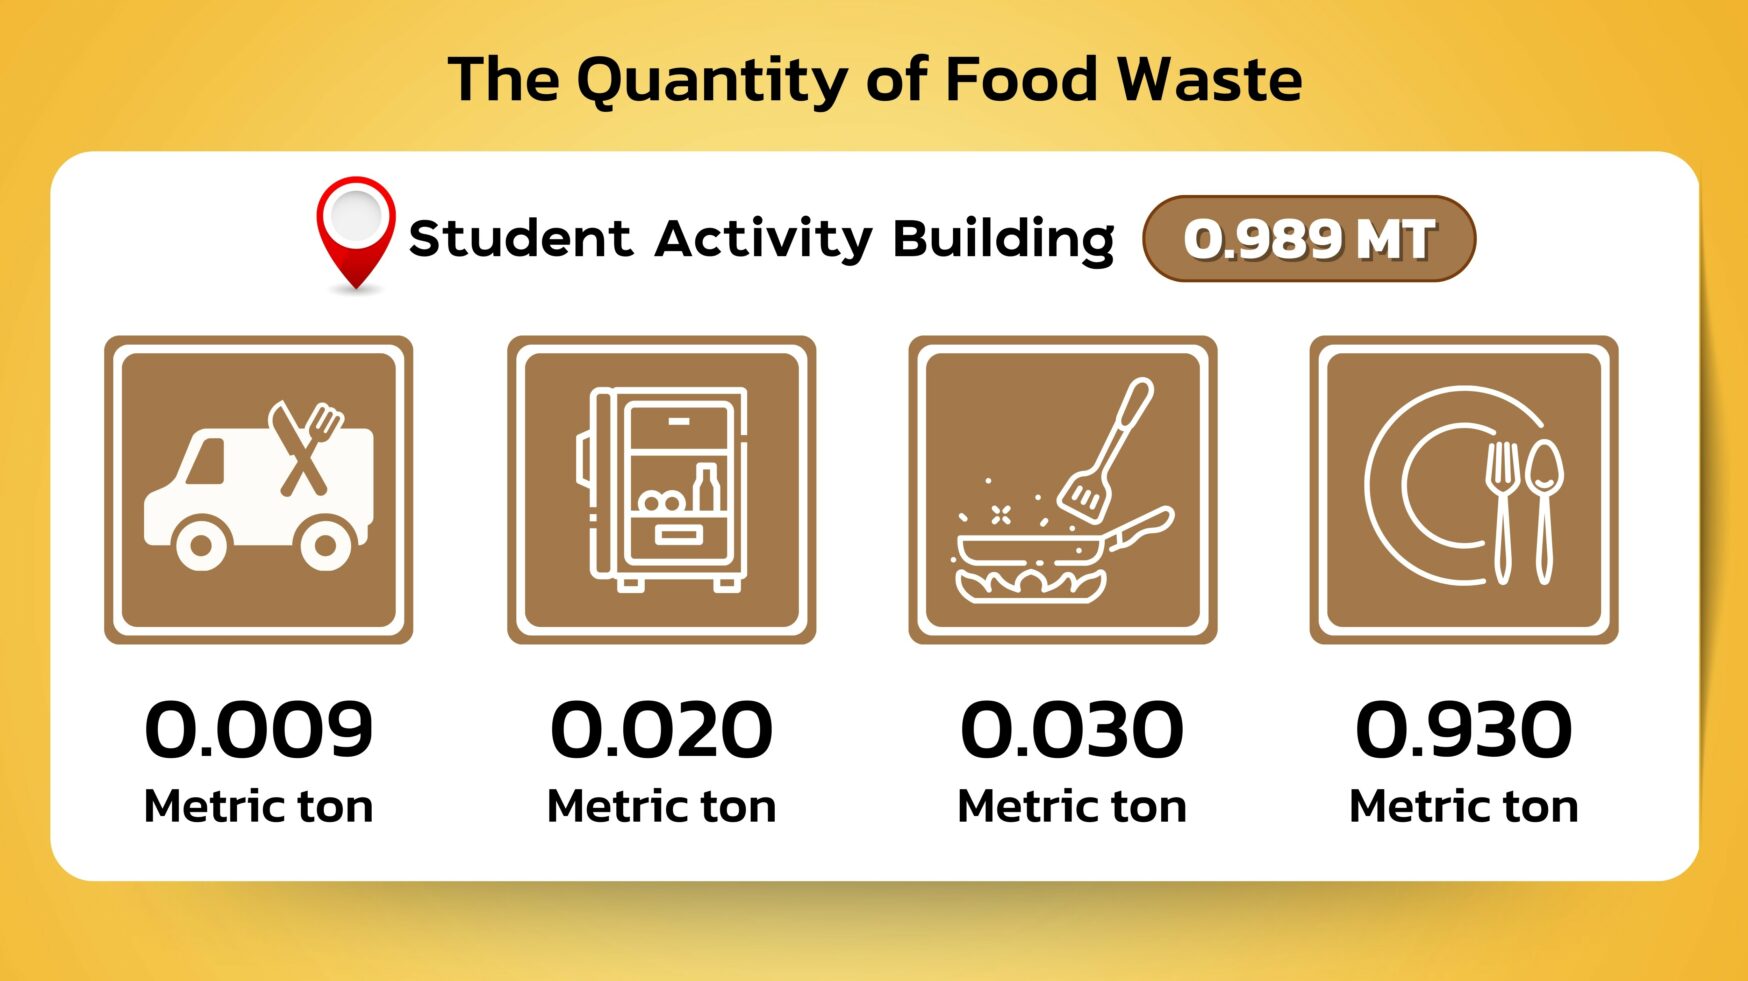
Student Activity Building Food Center
The Student Activity Building Food Center generated 0.989 metric ton of food waste, primarily from consumption at 0.930 metric ton (94.03%). Additional losses came from processing (0.030 metric ton, 3.03%), storage (0.020 metric ton, 2.02%), and transportation (0.009 metric ton, 0.91%).
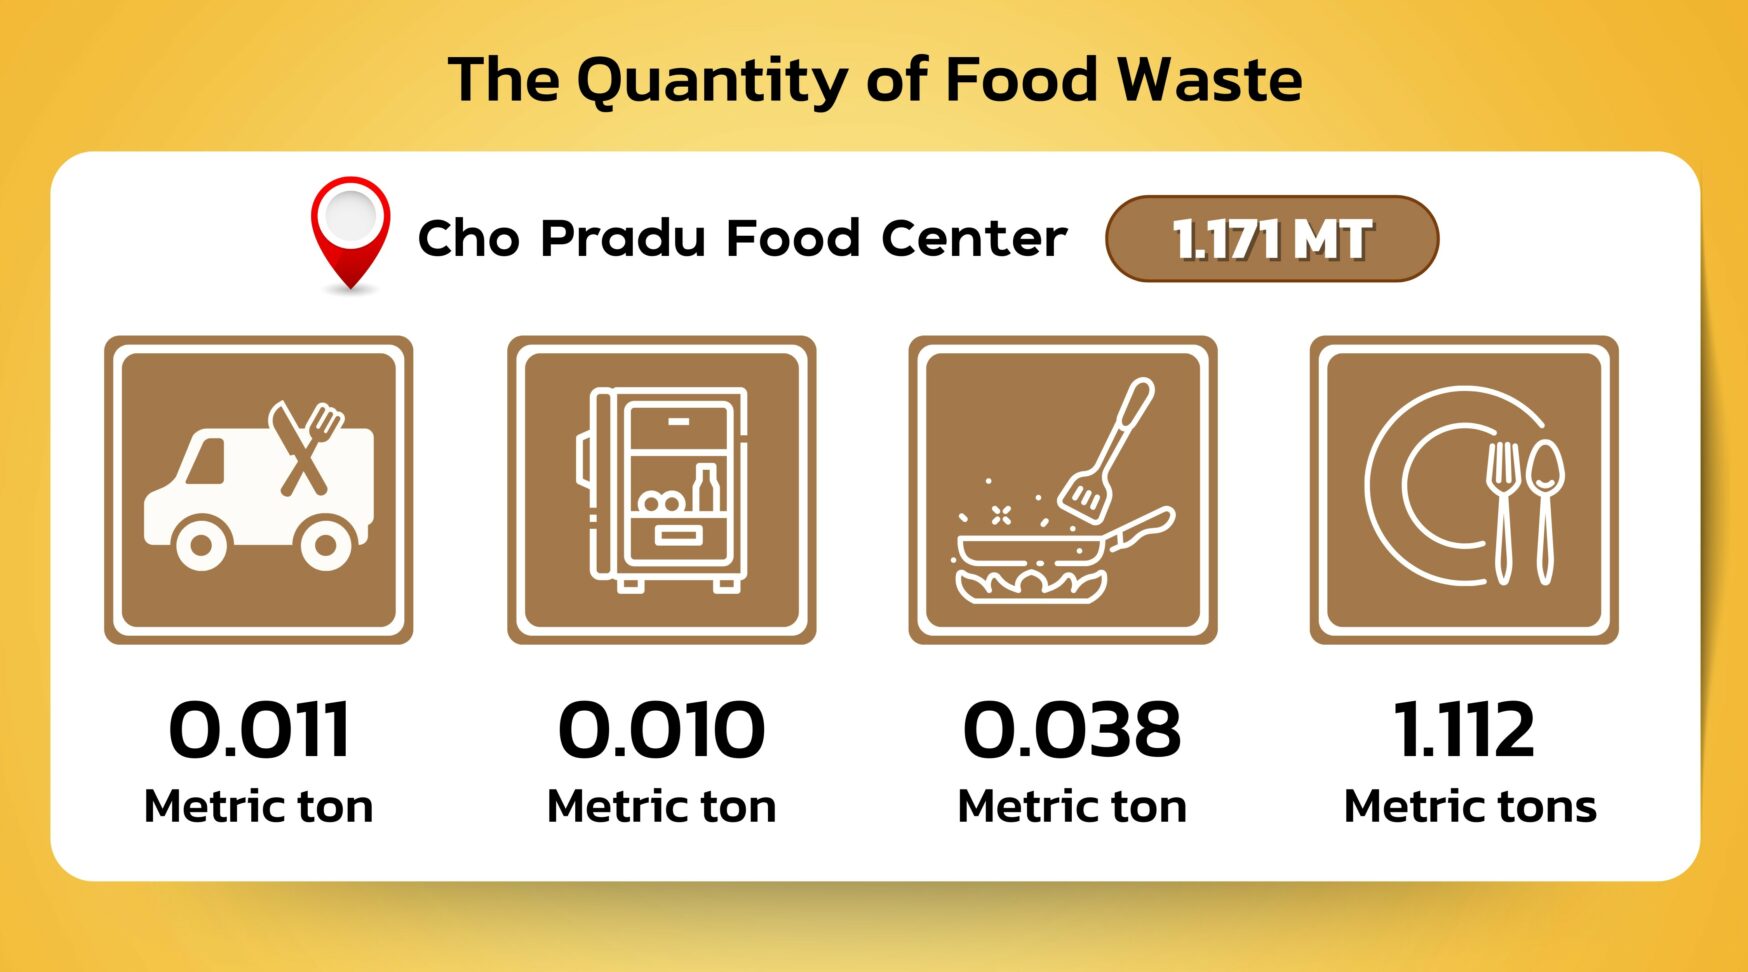
Cho Pradu Food Center
The Cho Pradu Food Center had the highest total among food centers, with 1.171 metric tons of food waste. Most came from consumption at 1.112 metric tons (94.96%), along with processing losses of 0.038 metric ton (3.25%) and small amounts from transportation and storage.
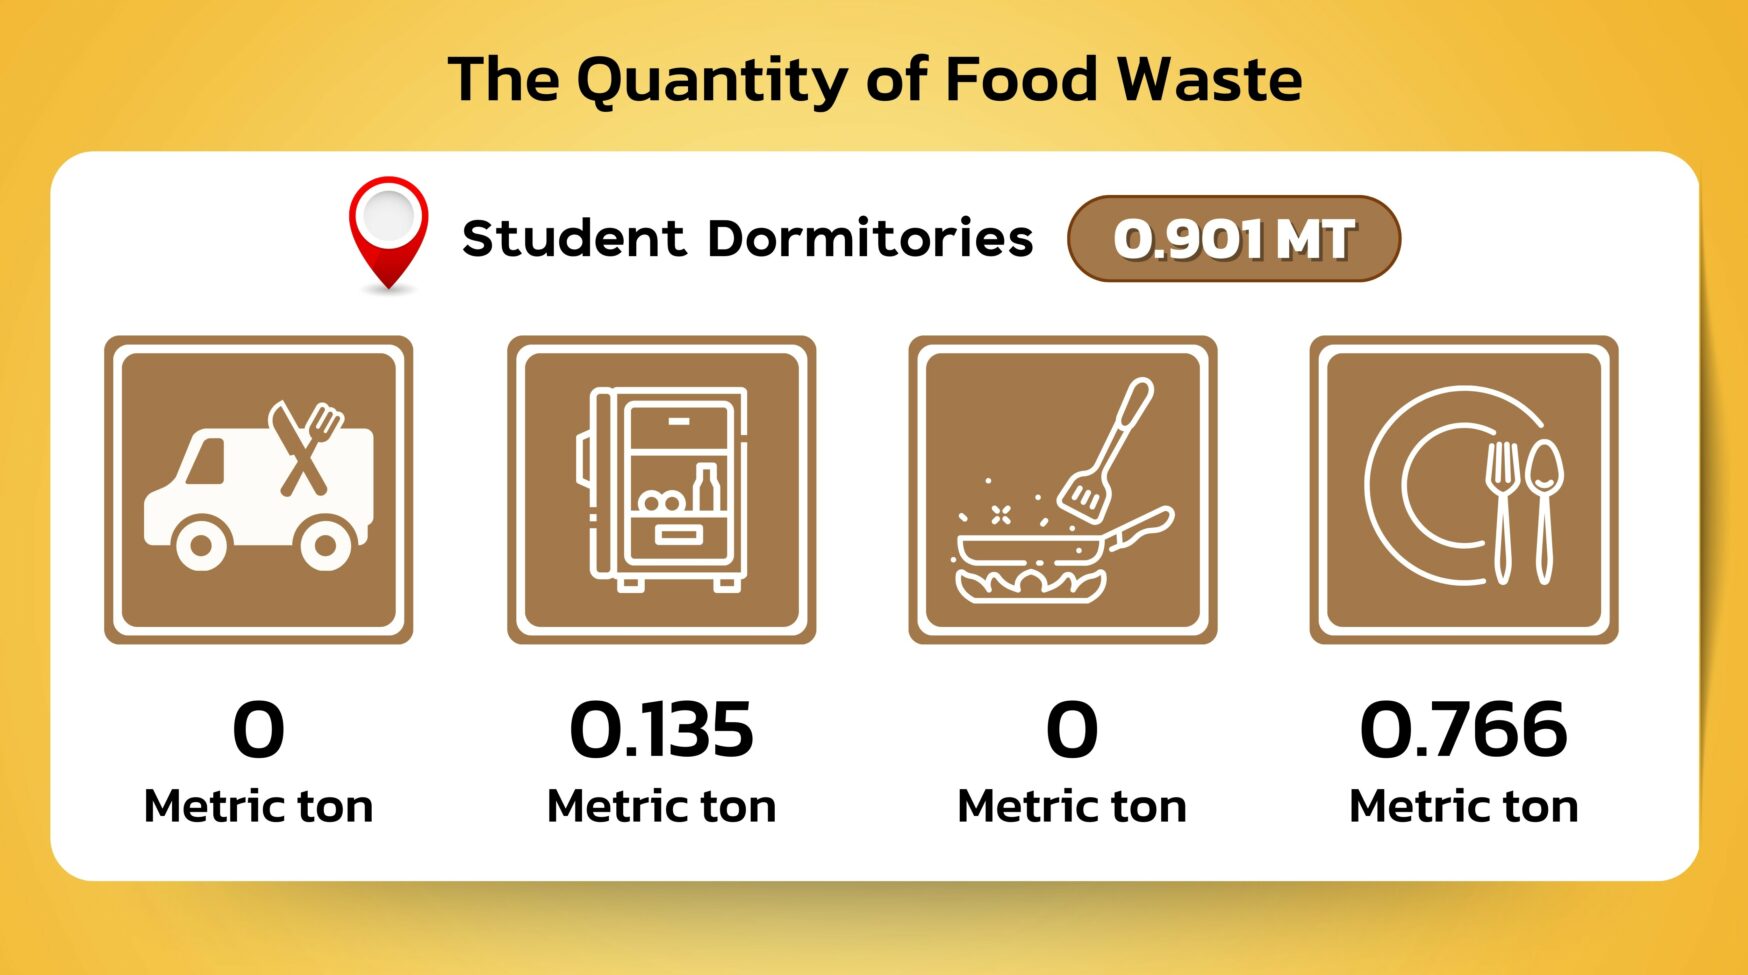
Student Dormitories
Student Dormitories generated food waste at 0.901 metric ton. Most of it came from consumption at 0.766 metric ton (85%), with storage contributing 0.135 metric ton (15%).
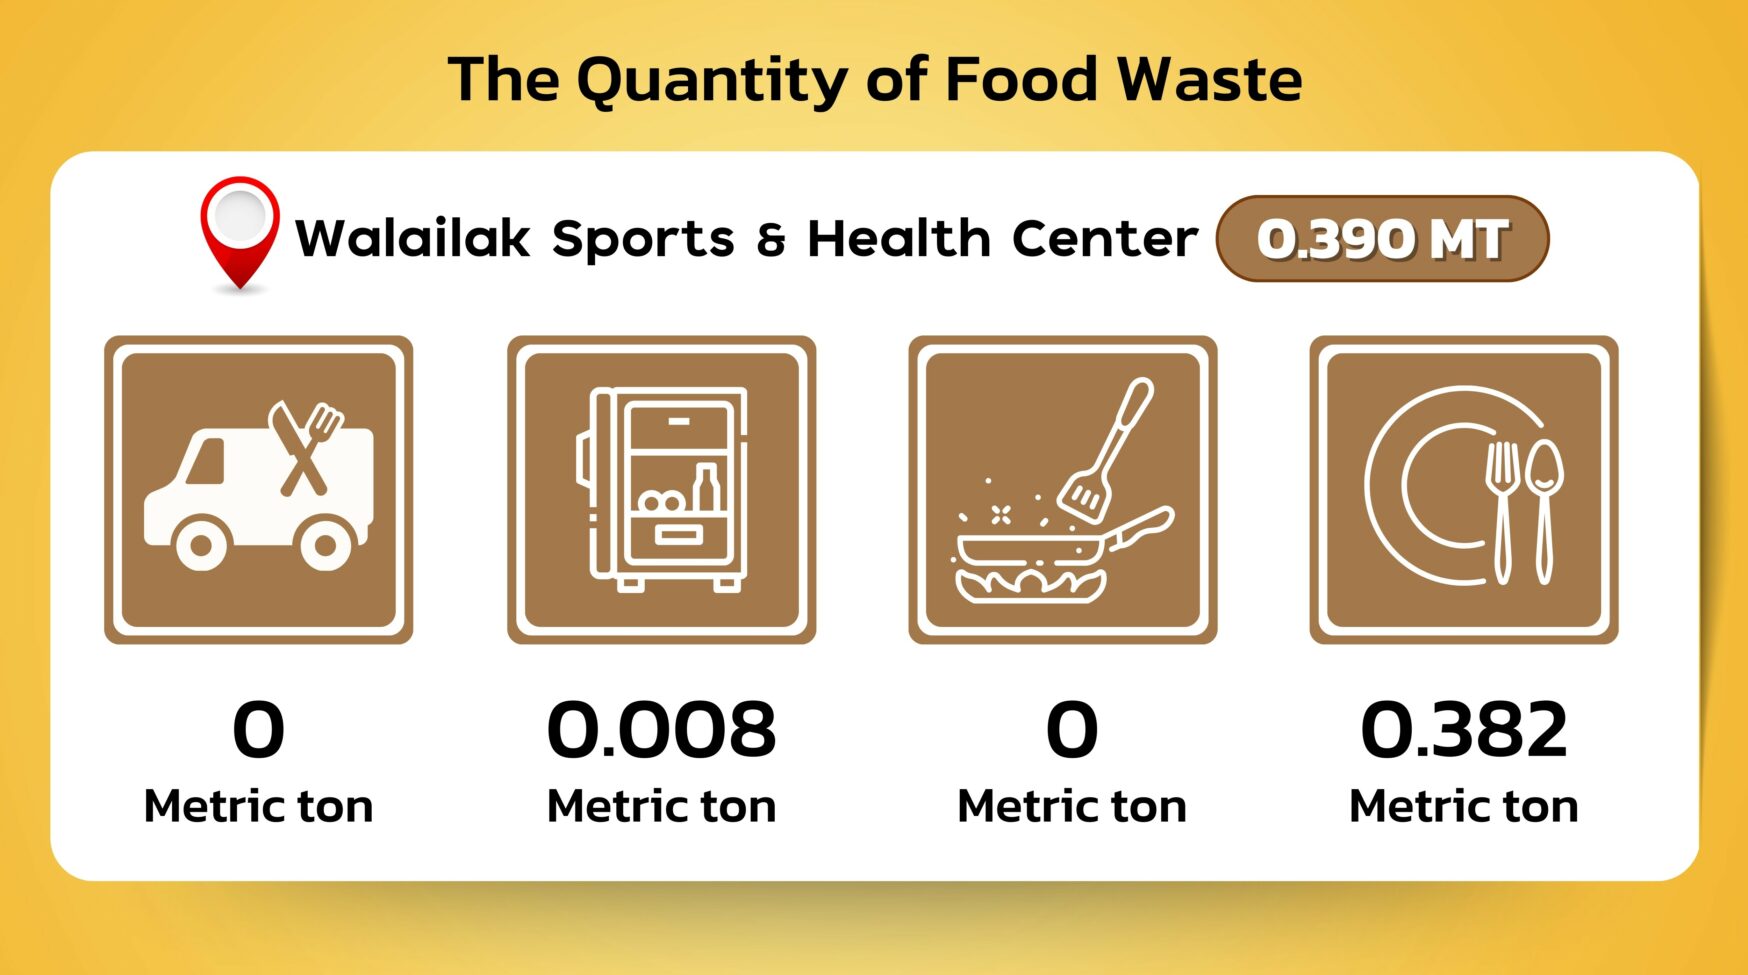
Walailak Sports & Health Center
The Walailak Sports & Health Center produced 0.390 metric ton of food waste, almost entirely from consumption at 0.382 metric ton (97.95%), with only a small amount from storage at 0.008 metric ton (2.05%).
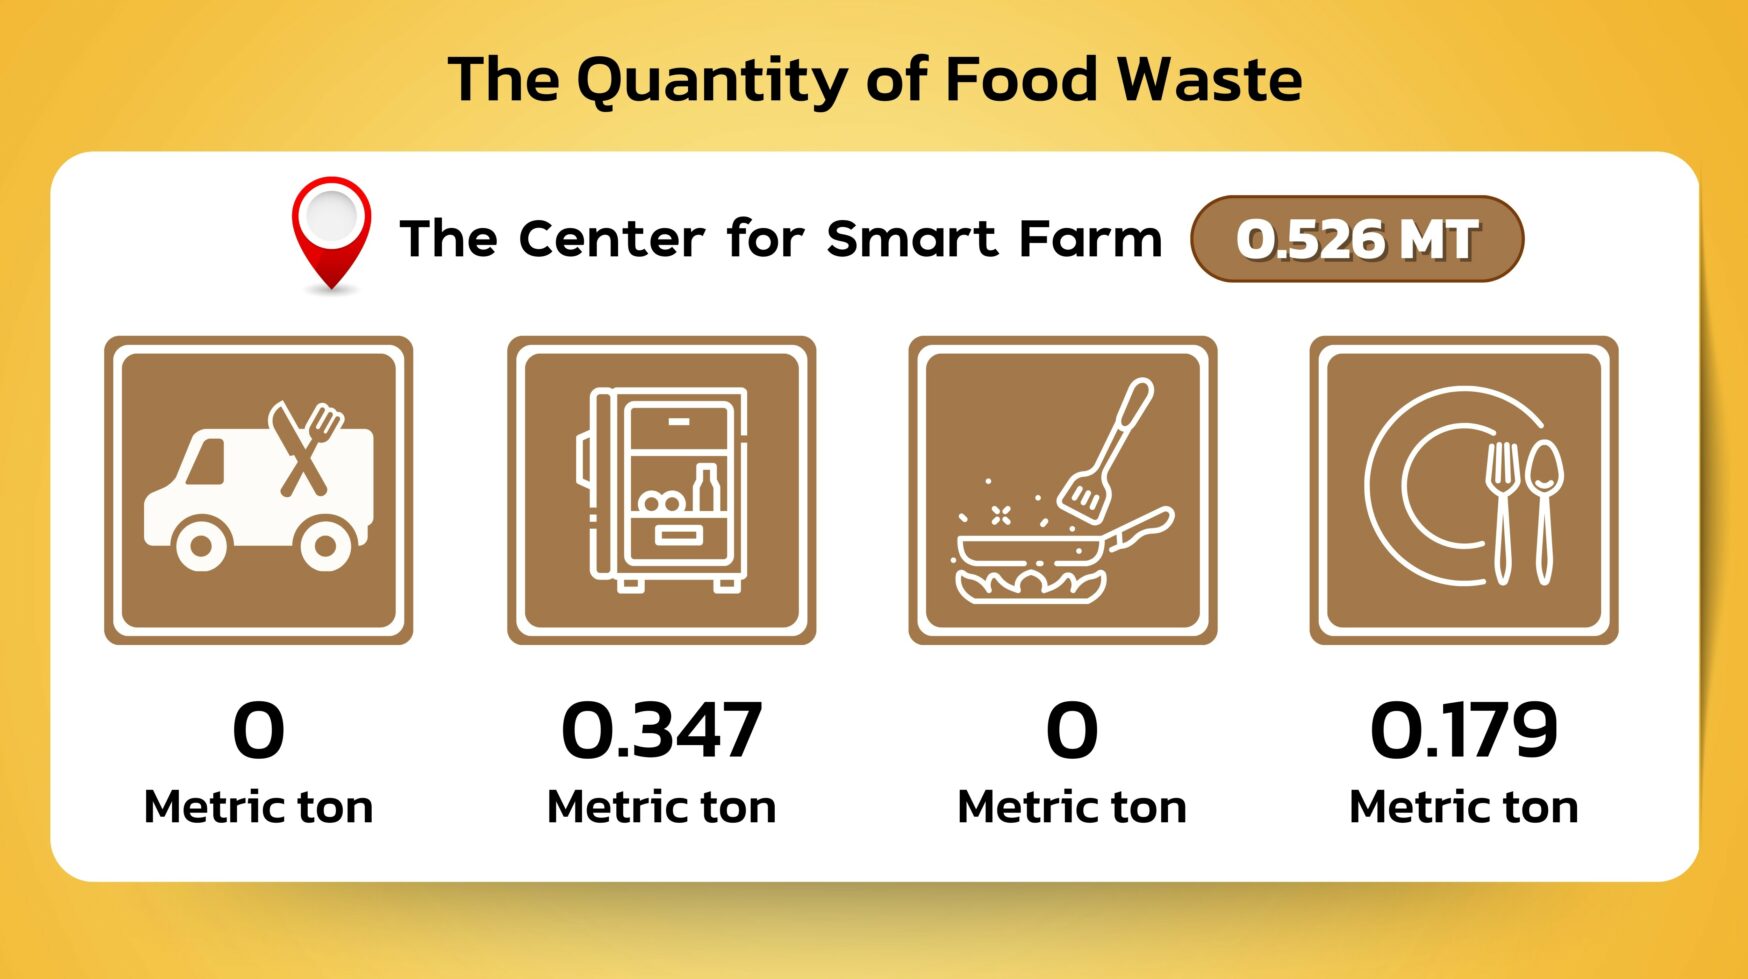
The Center for Smart Farm
The Center for Smart Farm generated 0.526 metric ton of food waste, mainly from storage at 0.347 metric ton (65.97%) and consumption at 0.179 metric ton (34.03%). Unlike other areas, the key issue here lies in agricultural product storage systems.
Summary of Food Waste Tracking Across the University
Monitoring and analysis revealed that the Cho Pradu Food Center generated the highest amount of food waste at 1.171 metric tons, followed by the staff dormitories (1.001 metric tons) and Student Activity Building Food Center (0.989 metric ton). The Large Animal Hospital produced the least, at 0.181 metric ton. In total, the university generated 7.258 metric tons of food waste, with the majority coming from consumption (86.47%), followed by storage (9.19%), processing (3.66%), and transportation (0.68%). Additionally, it can be categorized by process as follows:
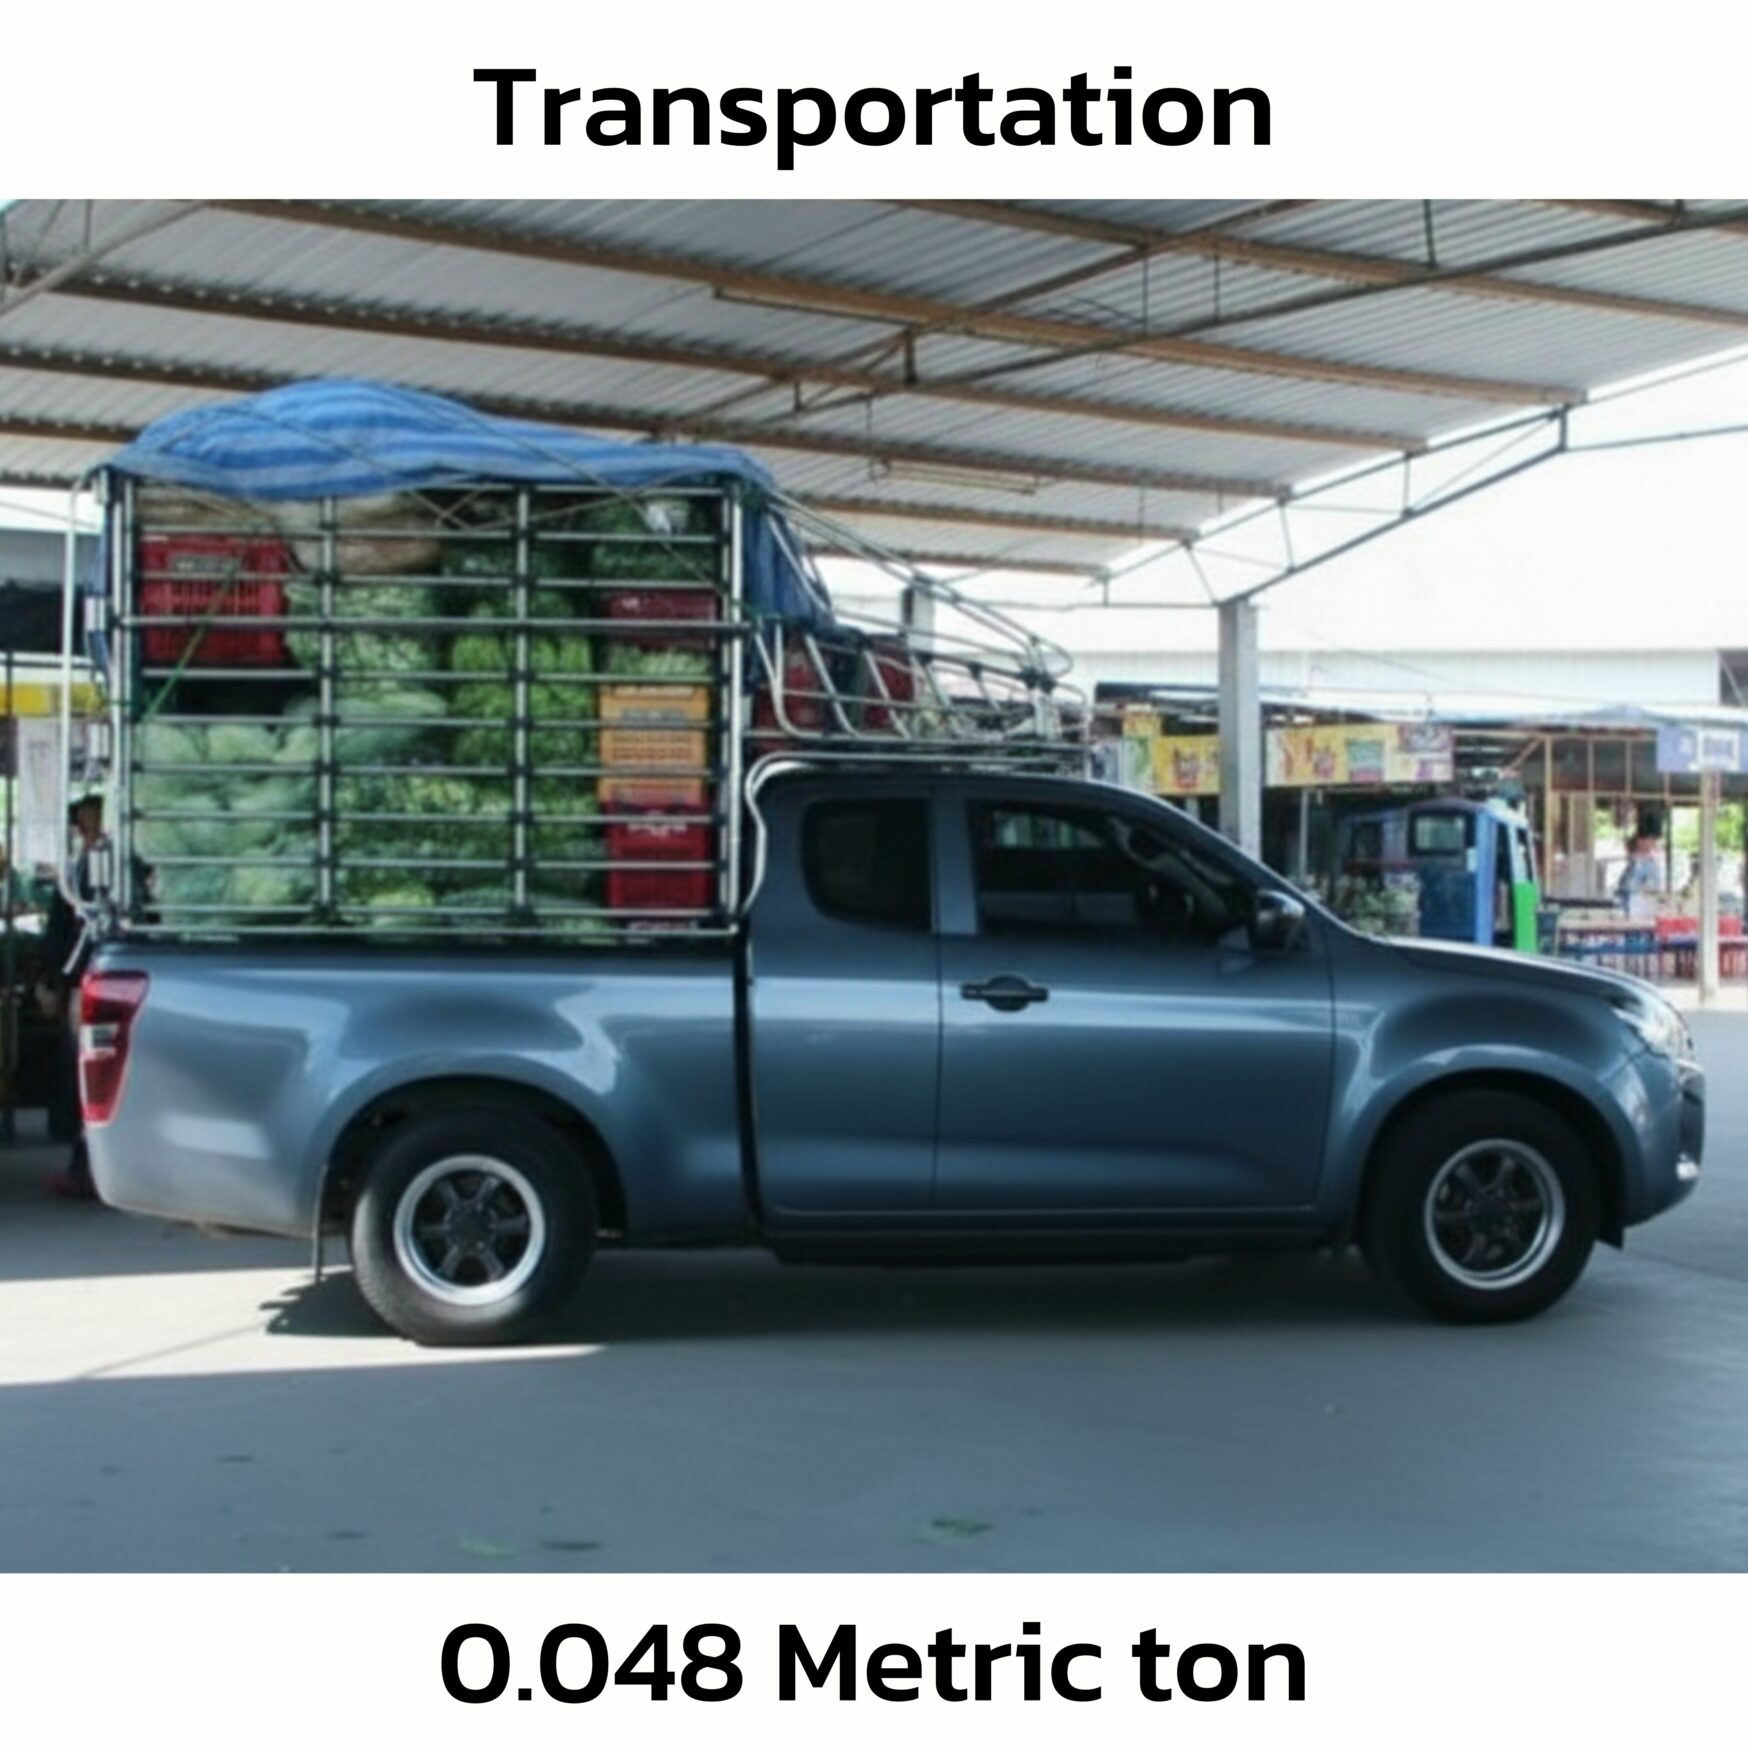
Transportation (0.048 metric ton: 0.68%)
The sources with the highest amount of food waste from transportation are The Chan Pradu Market and Cho Pradu Food Center, each generating 0.011 metric ton. This indicates that markets and food centers are more prone to food loss during the transportation of raw materials compared to other areas of the university.
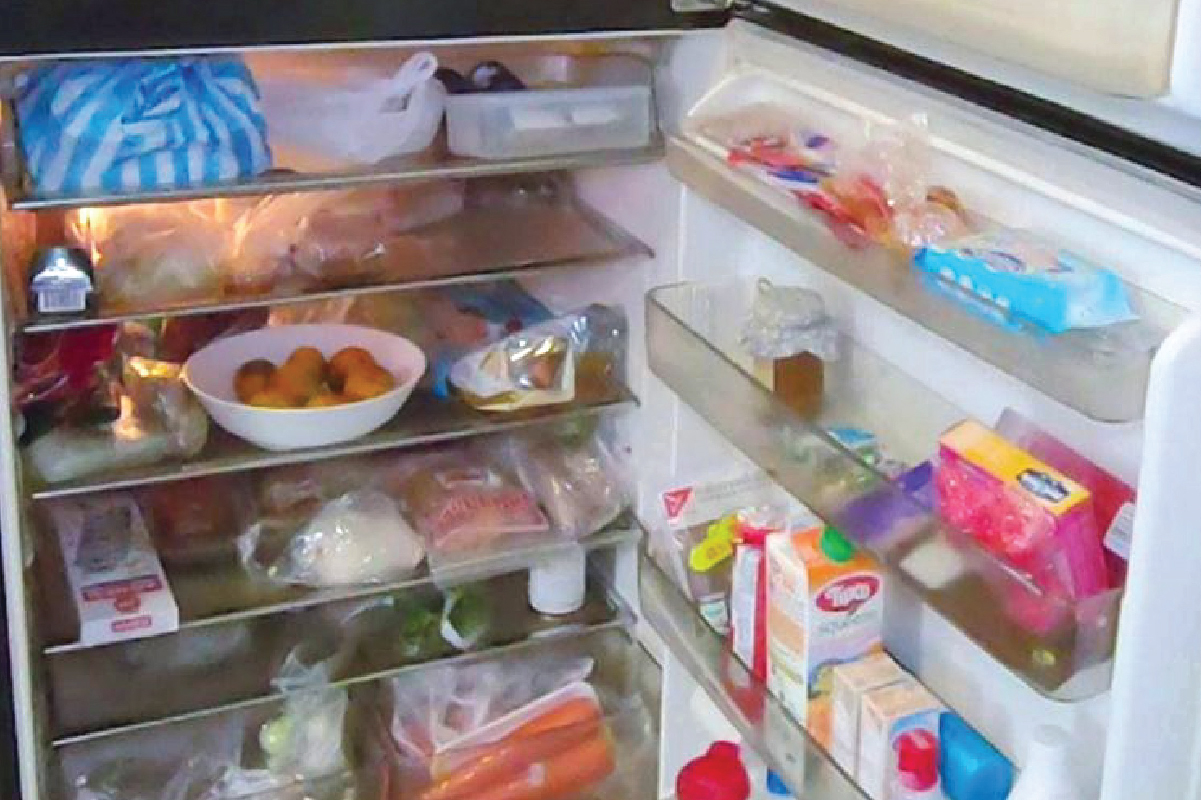
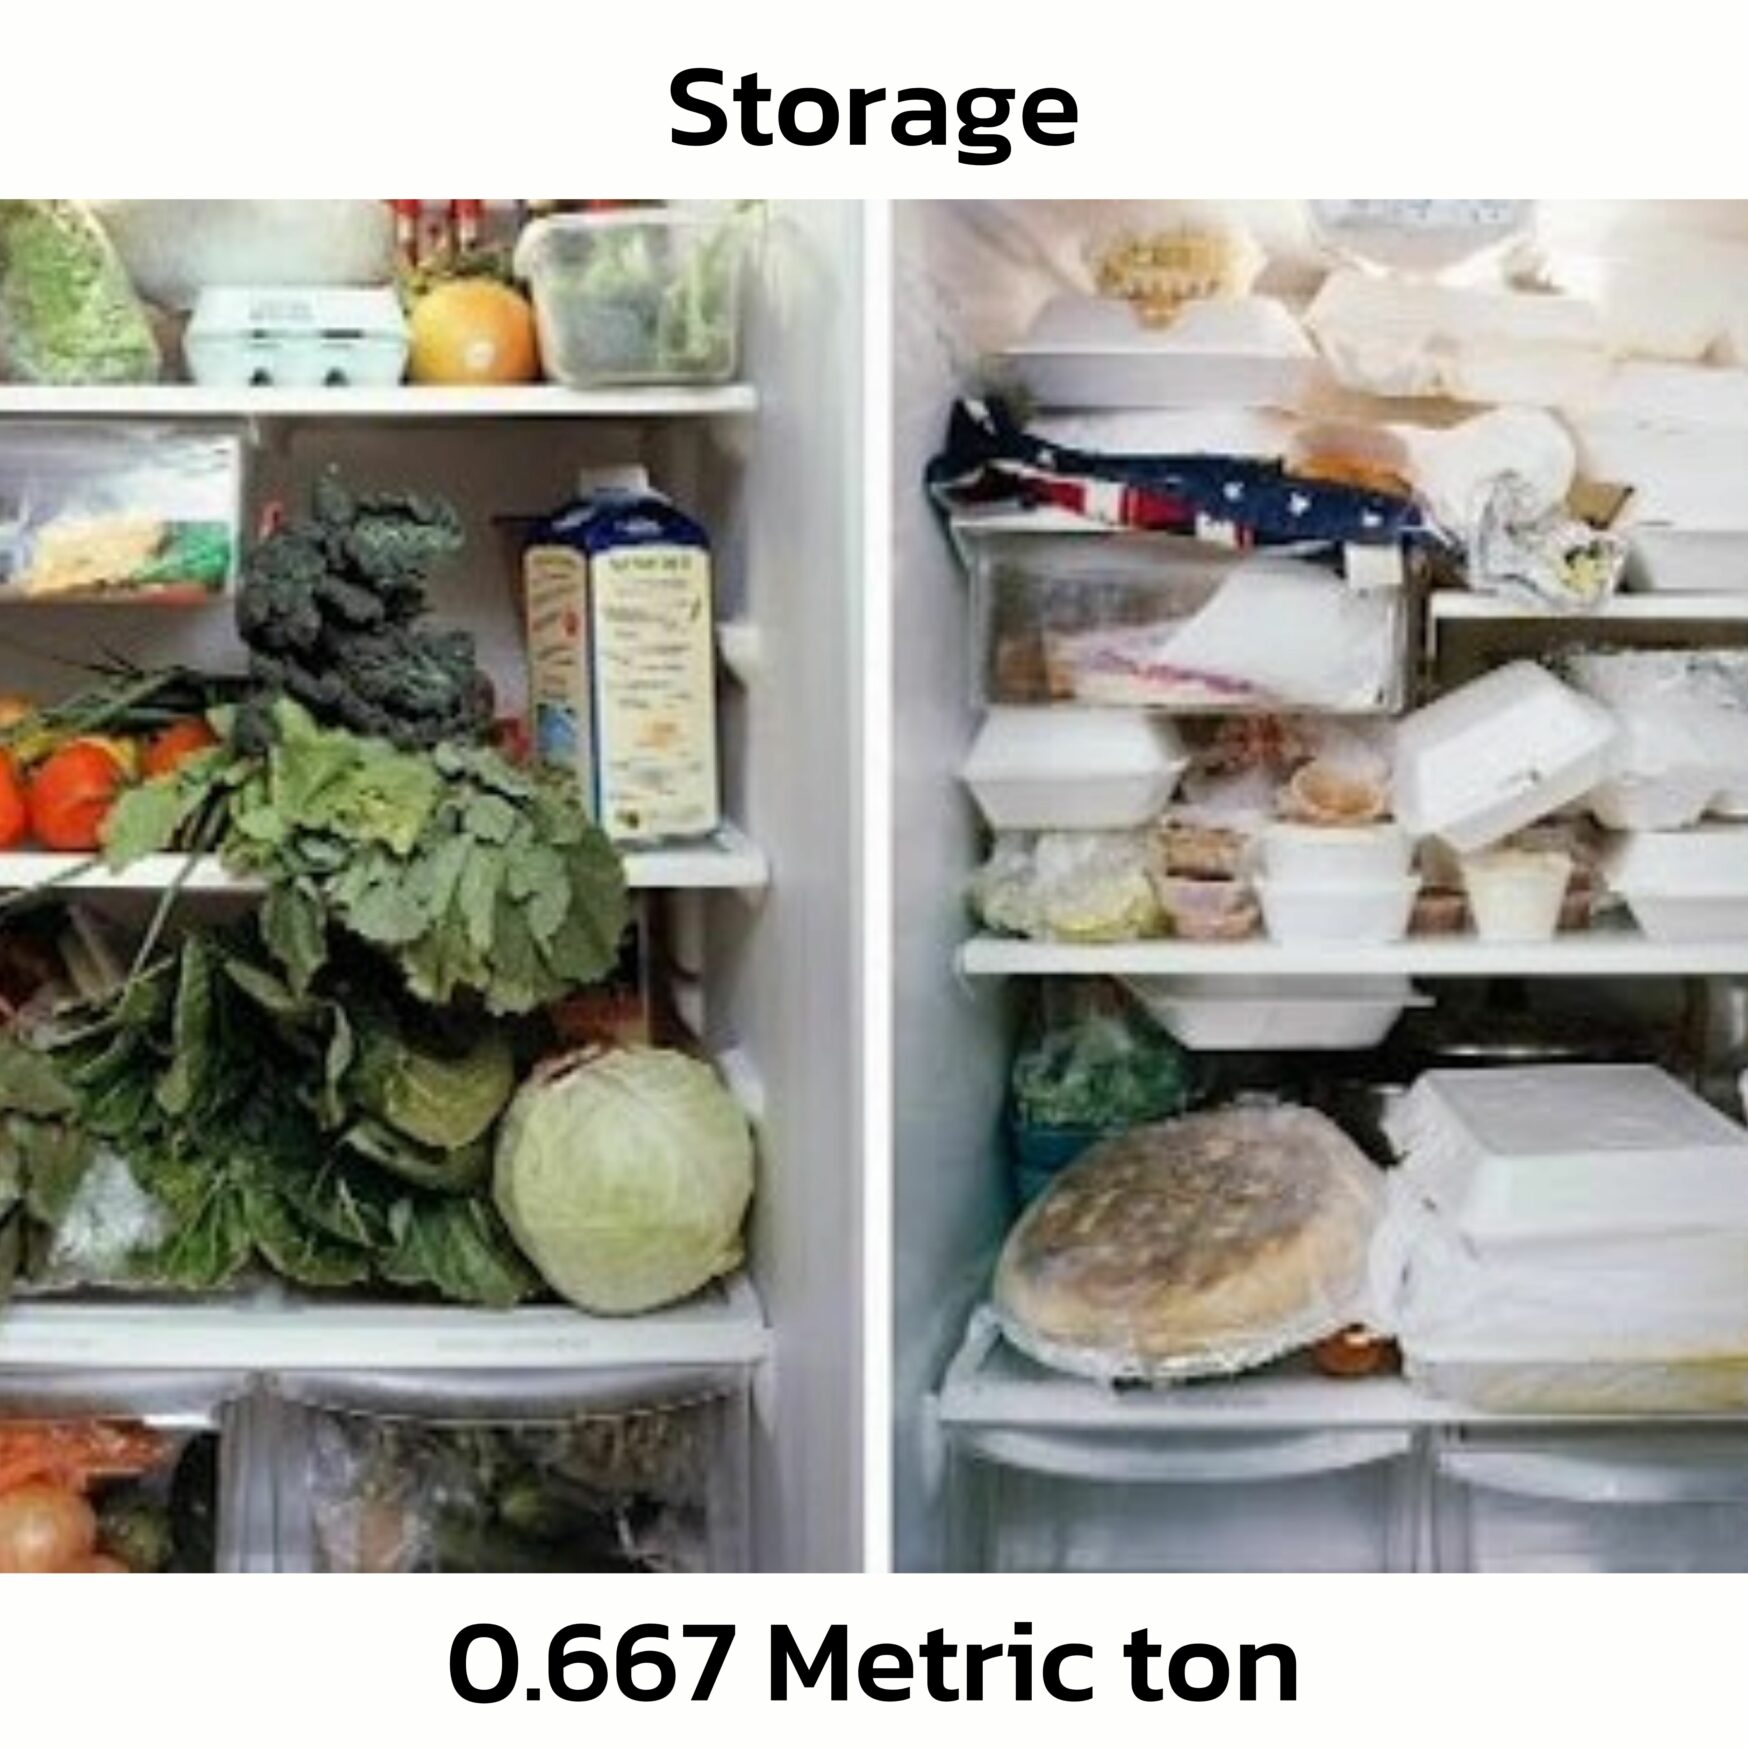
Storage (0.667 metric ton: 9.19%)
The highest food waste from storage was found at The Center for Smart Farm, accounting for 0.347 metric ton (65.97% of waste at this location), followed by Student Dormitories with 0.135 metric ton (15%). This reflects significant problems with the preservation and storage of agricultural products and food, particularly at Smart Farm, where storage-related losses are the highest.
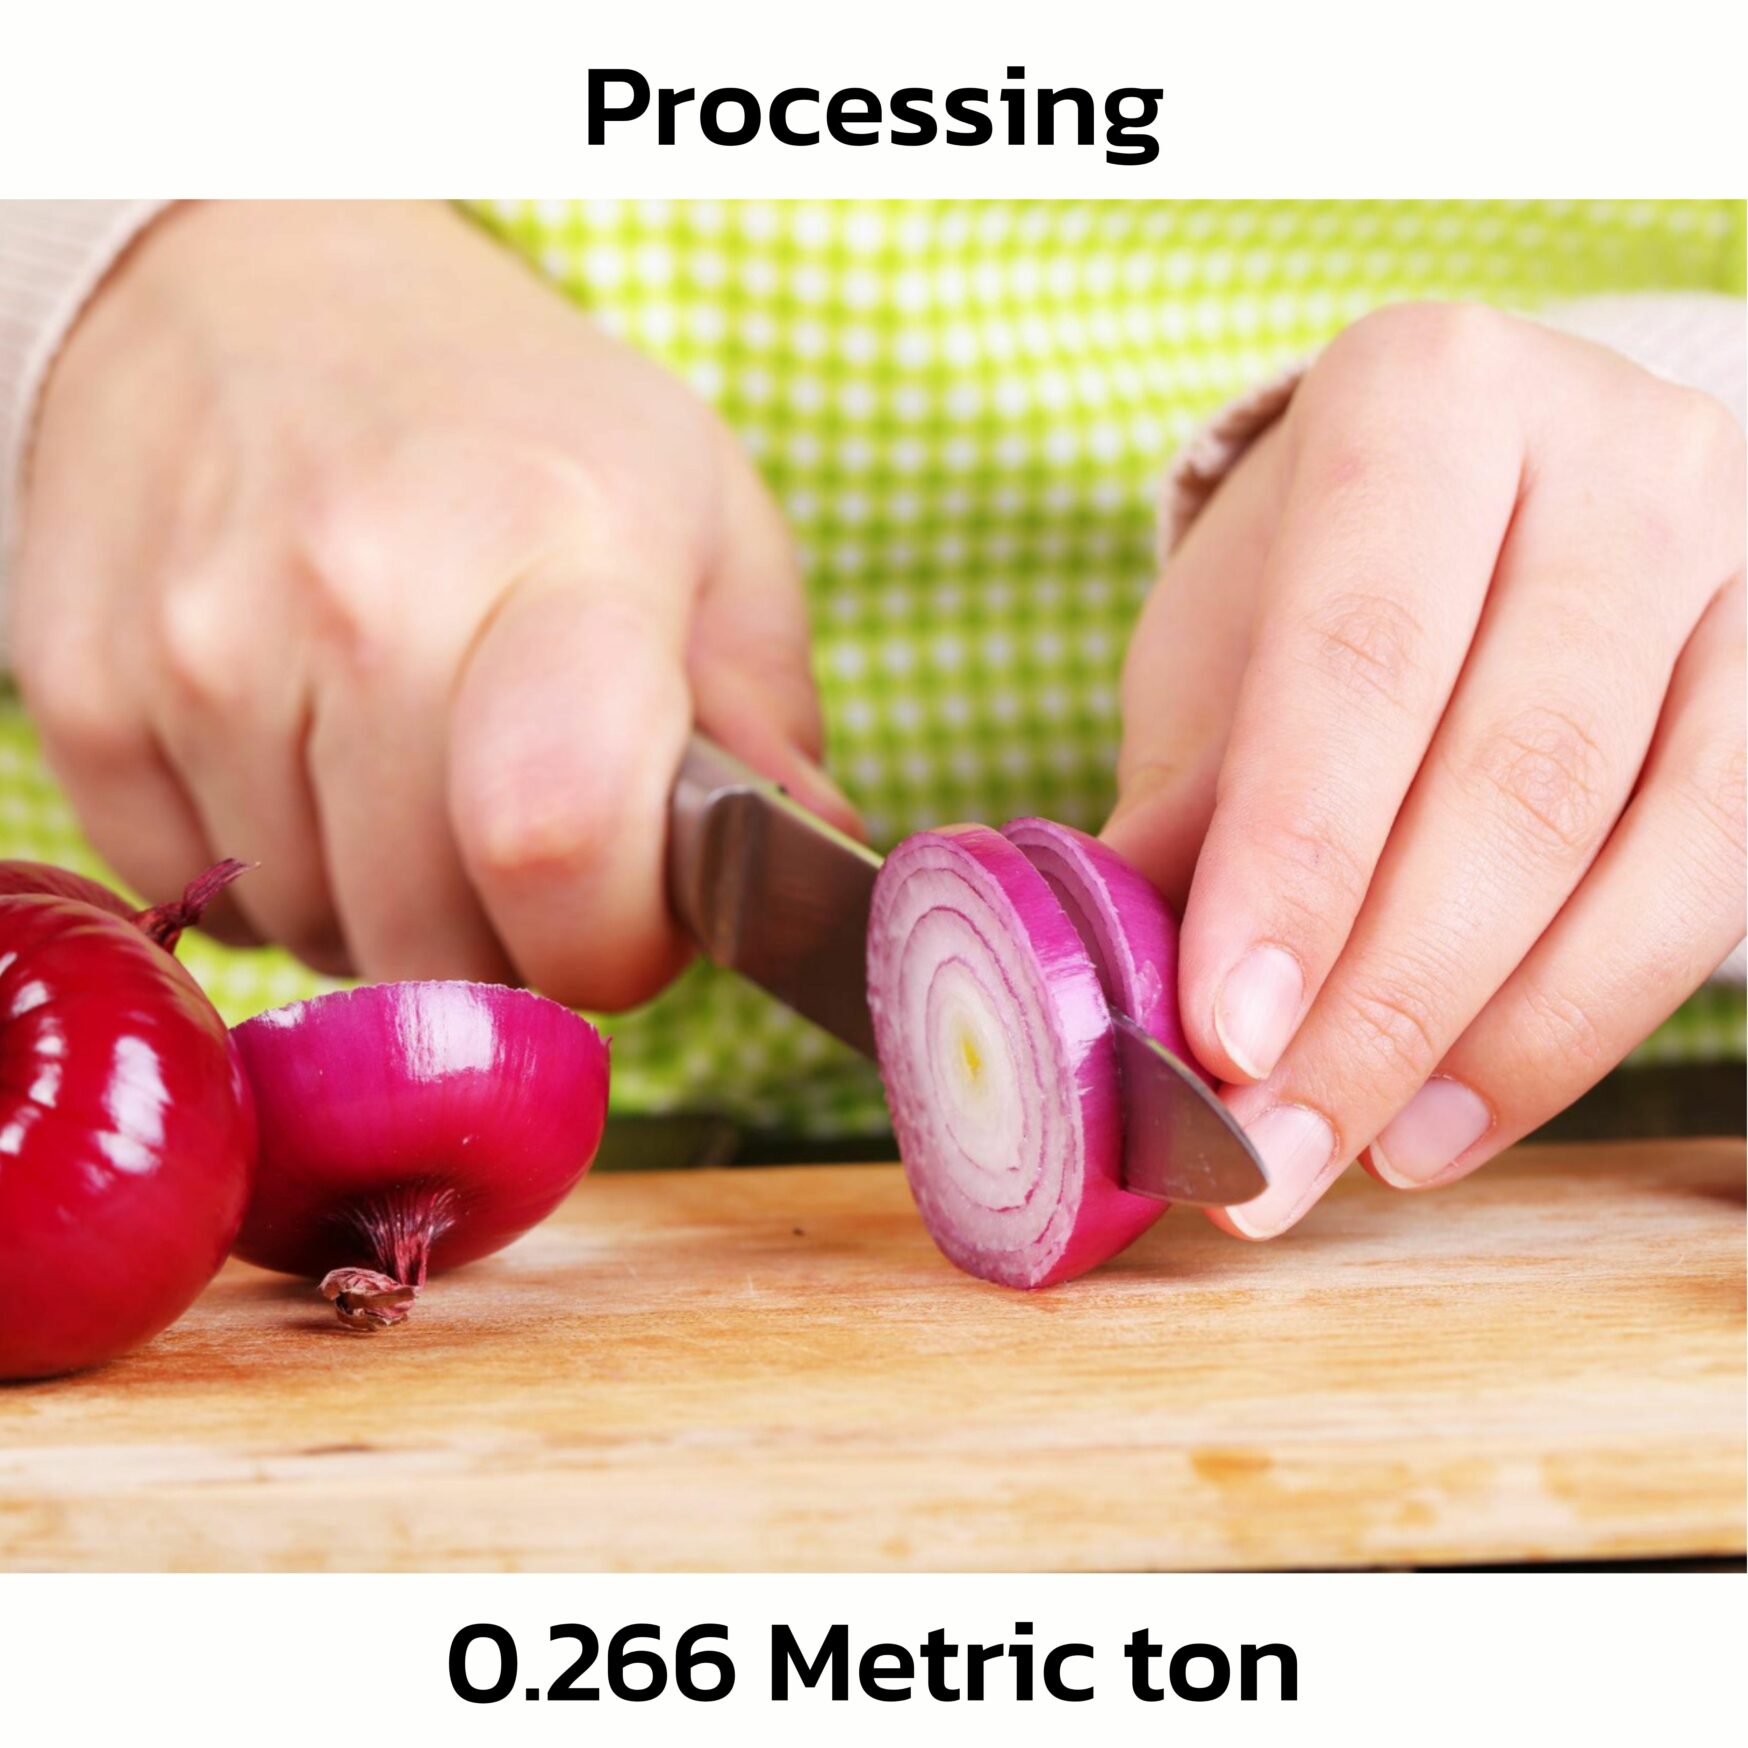
Processing (0.266 metric ton: 3.66%)
The source with the highest food waste from processing is the Staff Dormitories, generating 0.150 metric ton (14.99%), which is higher than all other locations on campus. This issue may stem from household-level food preparation, cooking more than necessary, or improper handling of leftover materials during food preparation.
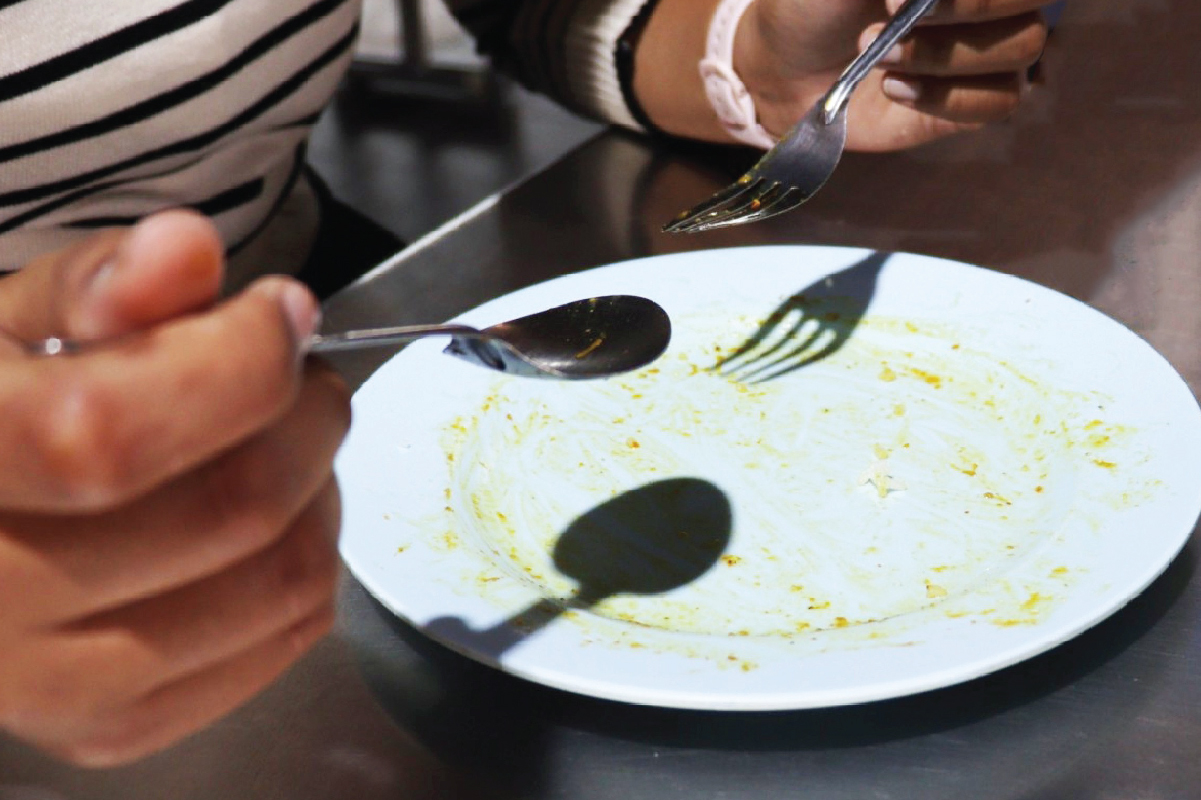
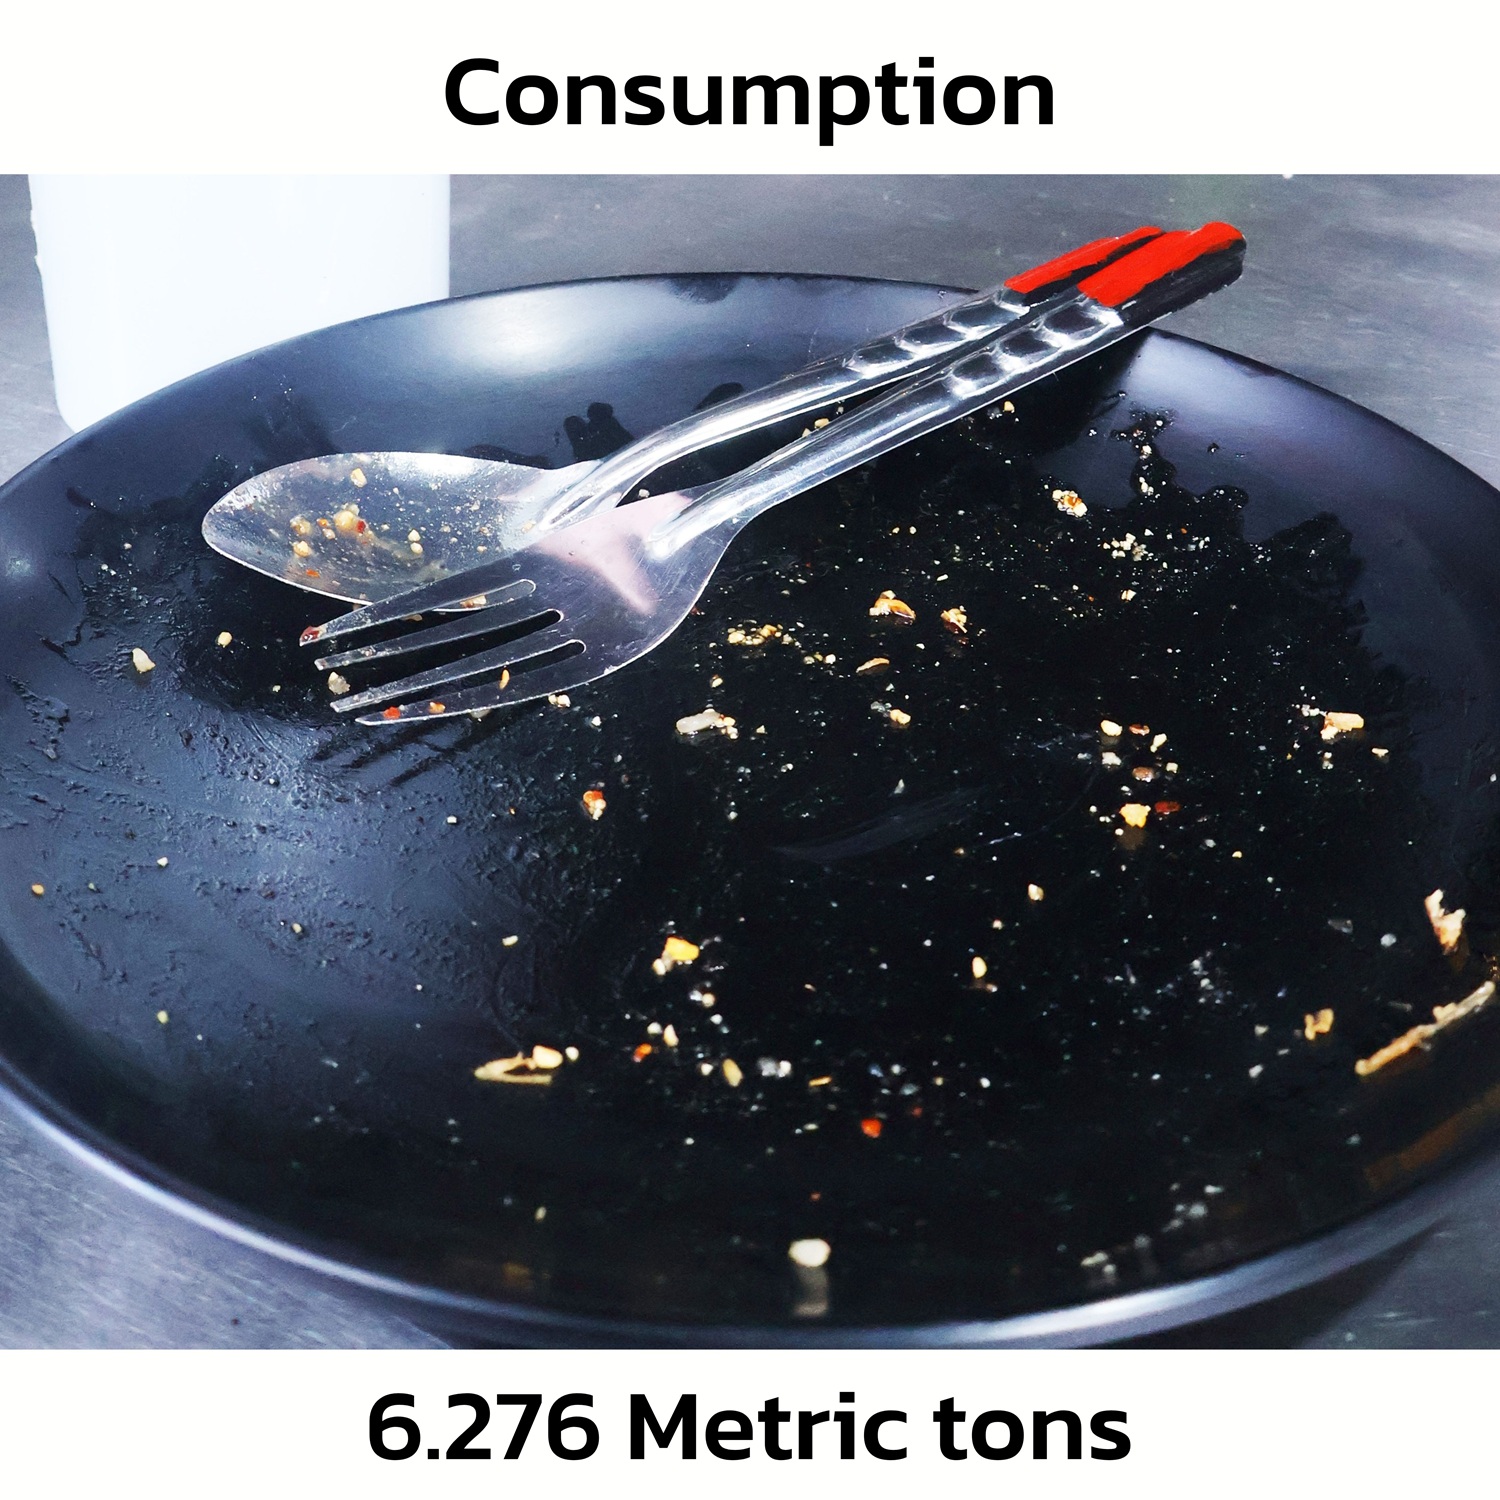
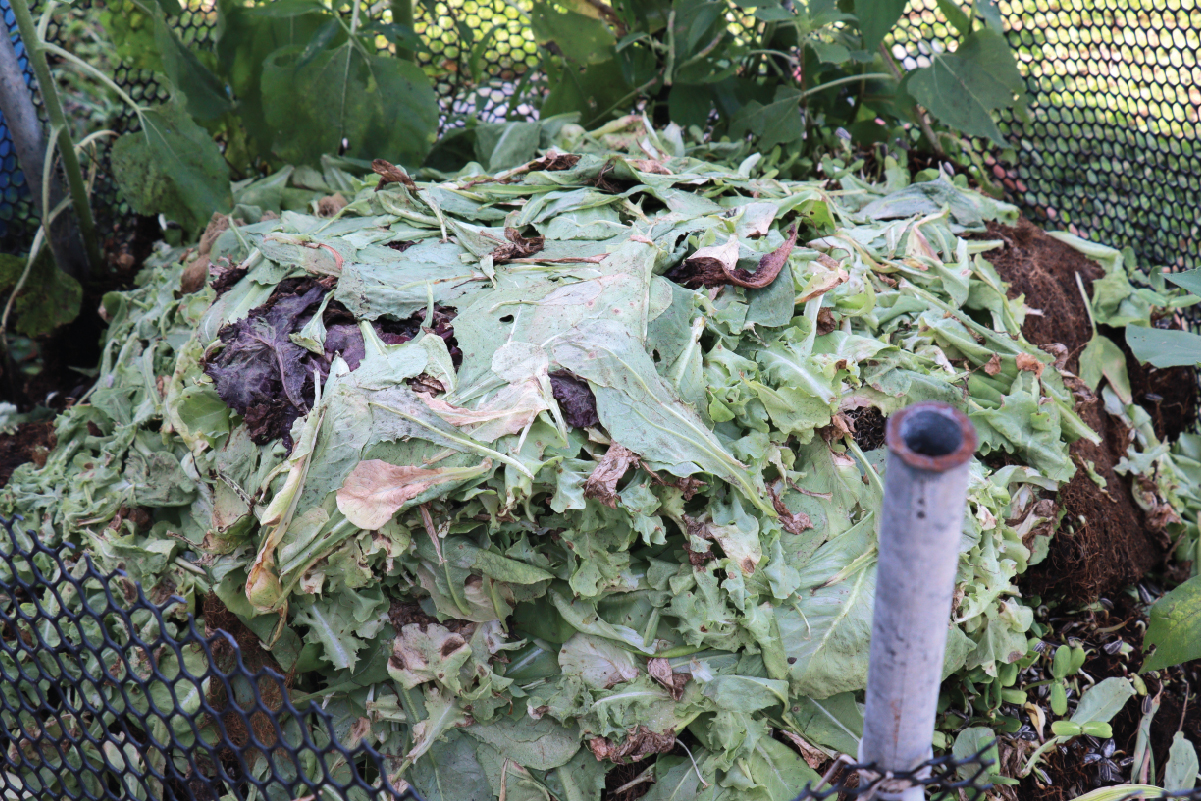
Consumption (6.276 metric tons: 86.47%)
The main cause of food waste at the university is consumption, with the Cho Pradu Food Center being the largest source at 1.112 metric tons (94.96% of waste at this location), followed by the Student Activity Building Food Center at 0.930 metric ton (97.95%). This highlights that students’ consumption behavior in large food centers is the primary factor driving the majority of food waste across the university.
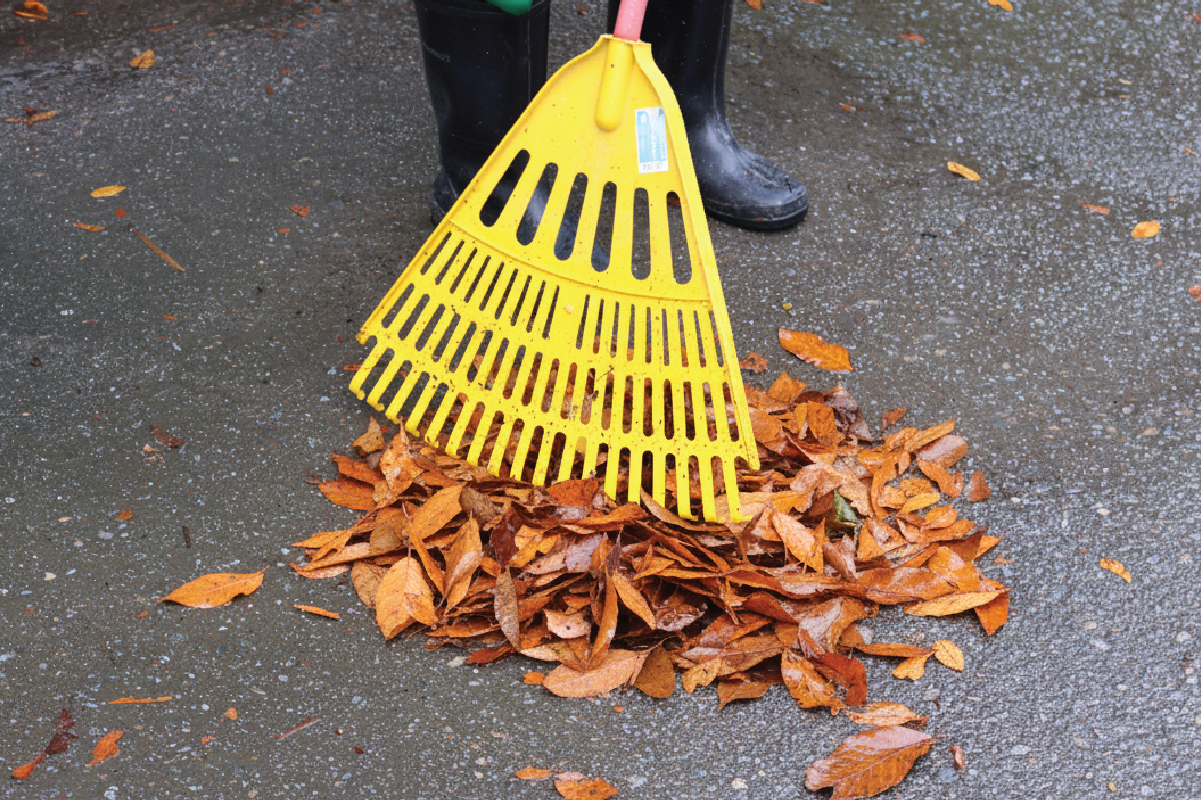
Figures : The Primary Contributors to Food Waste.
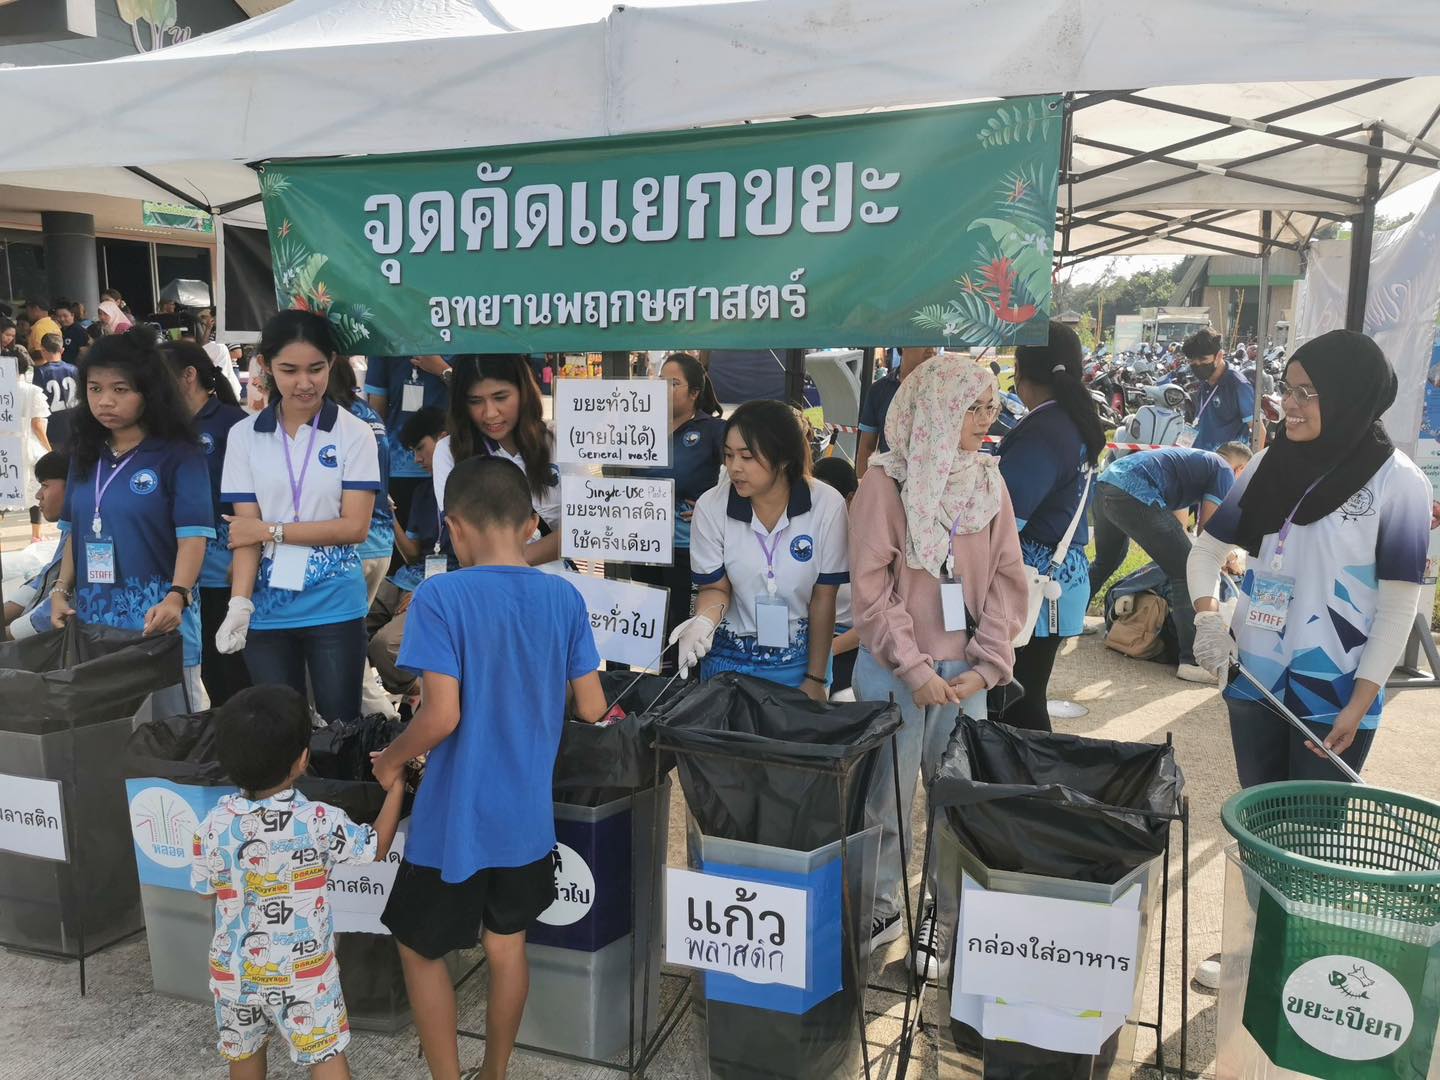
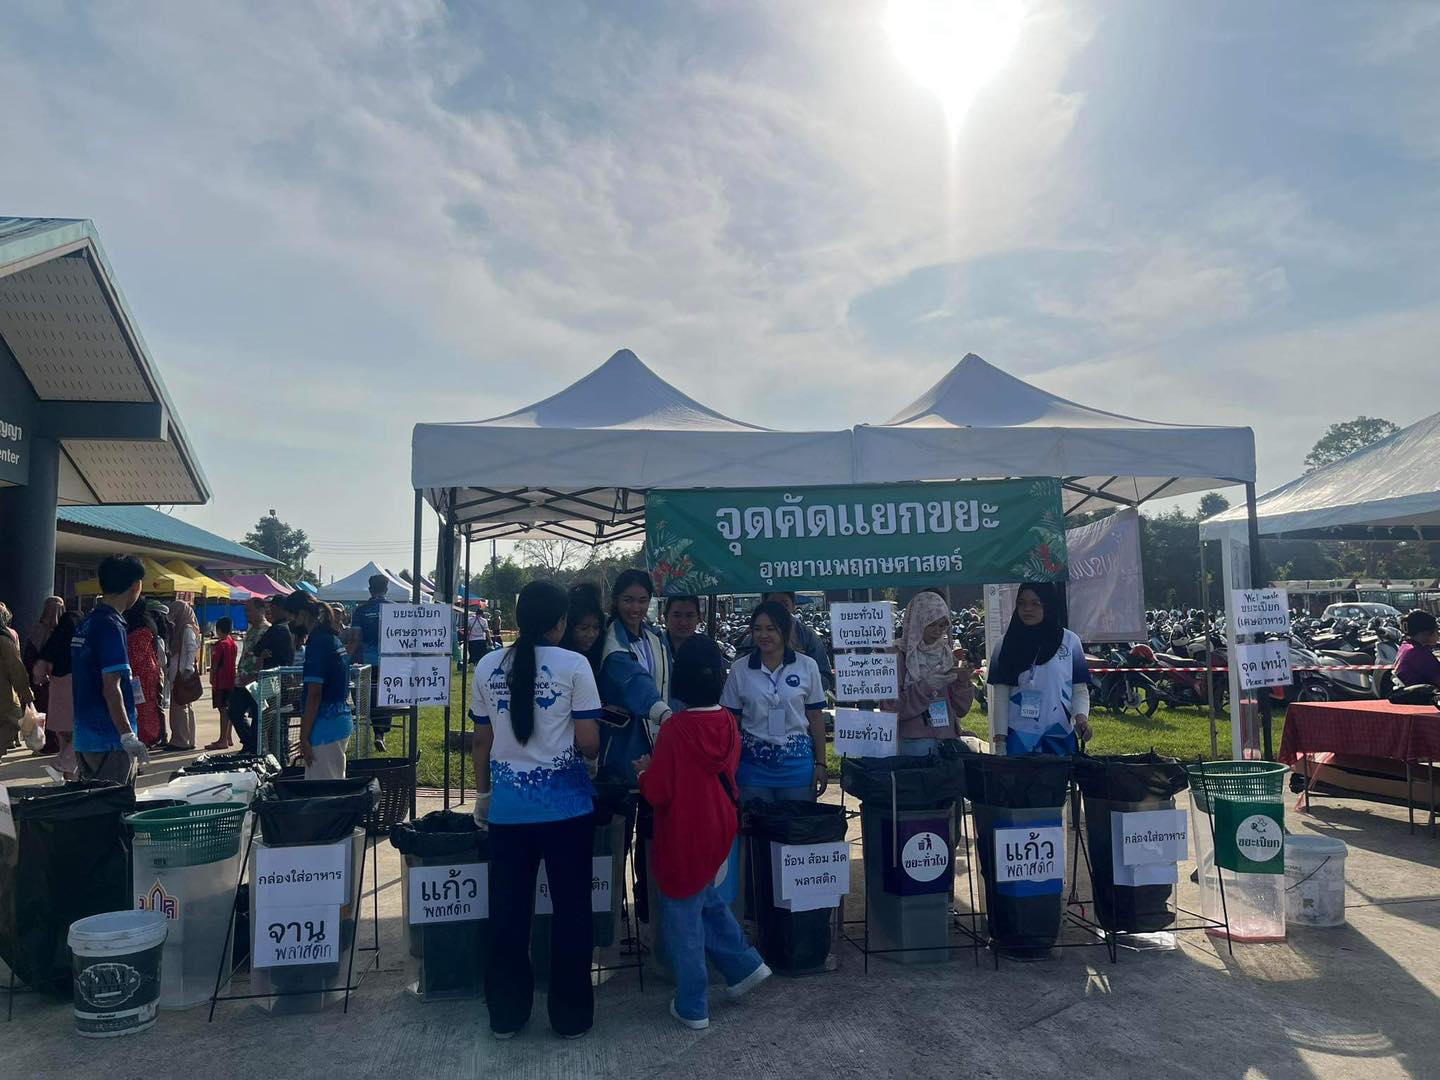
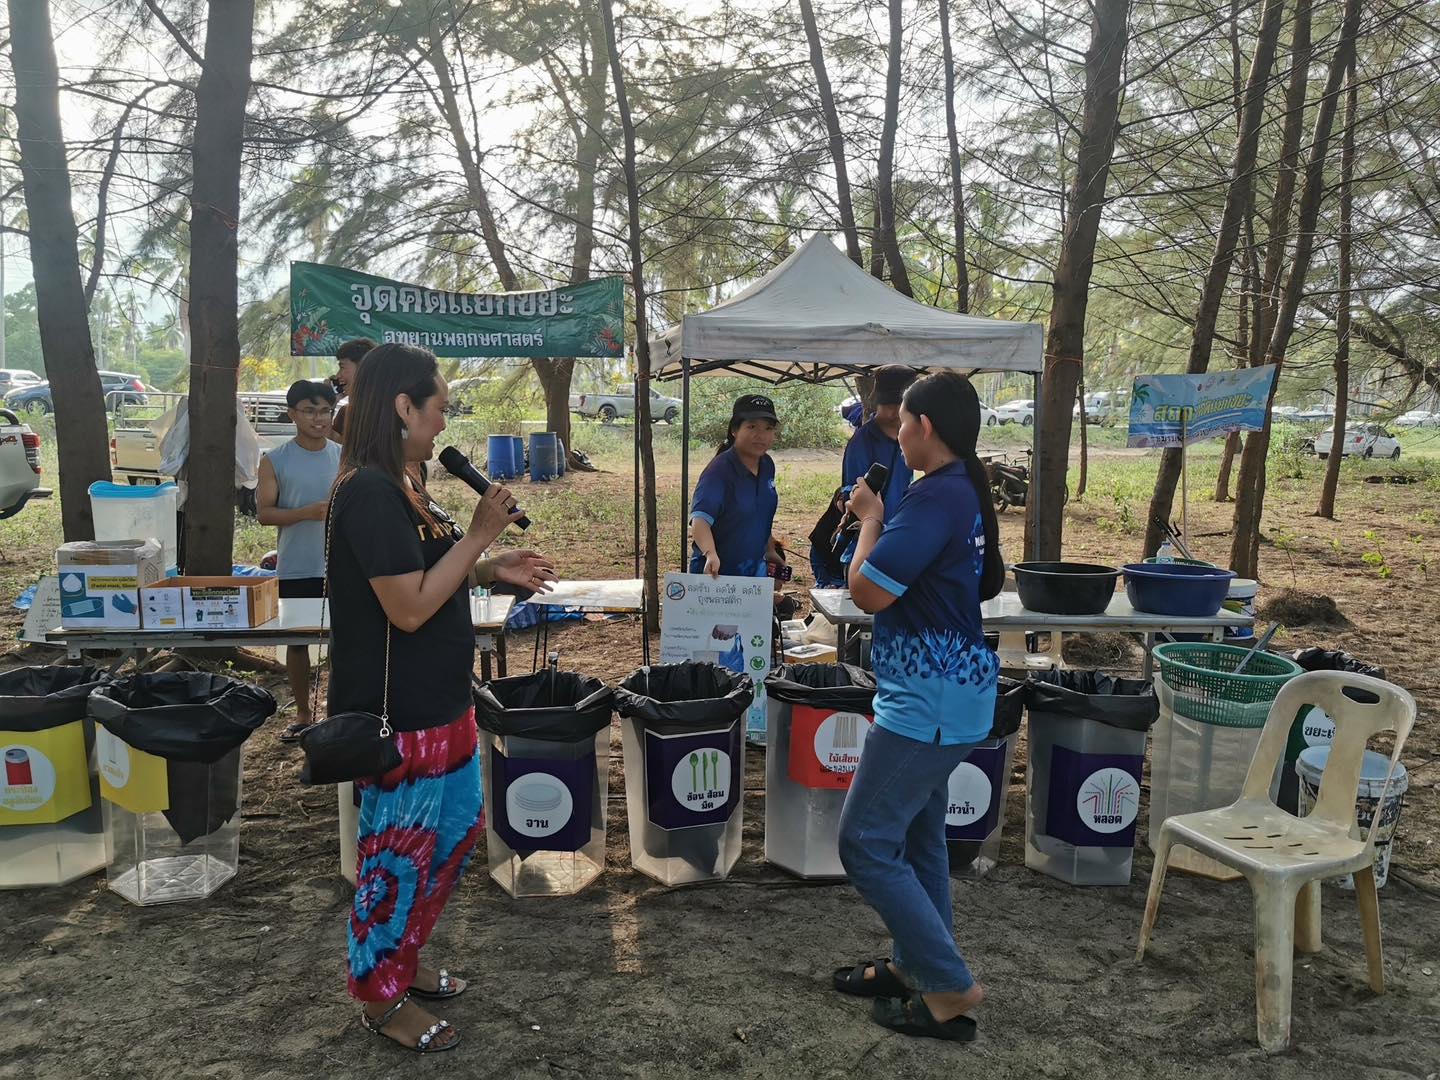
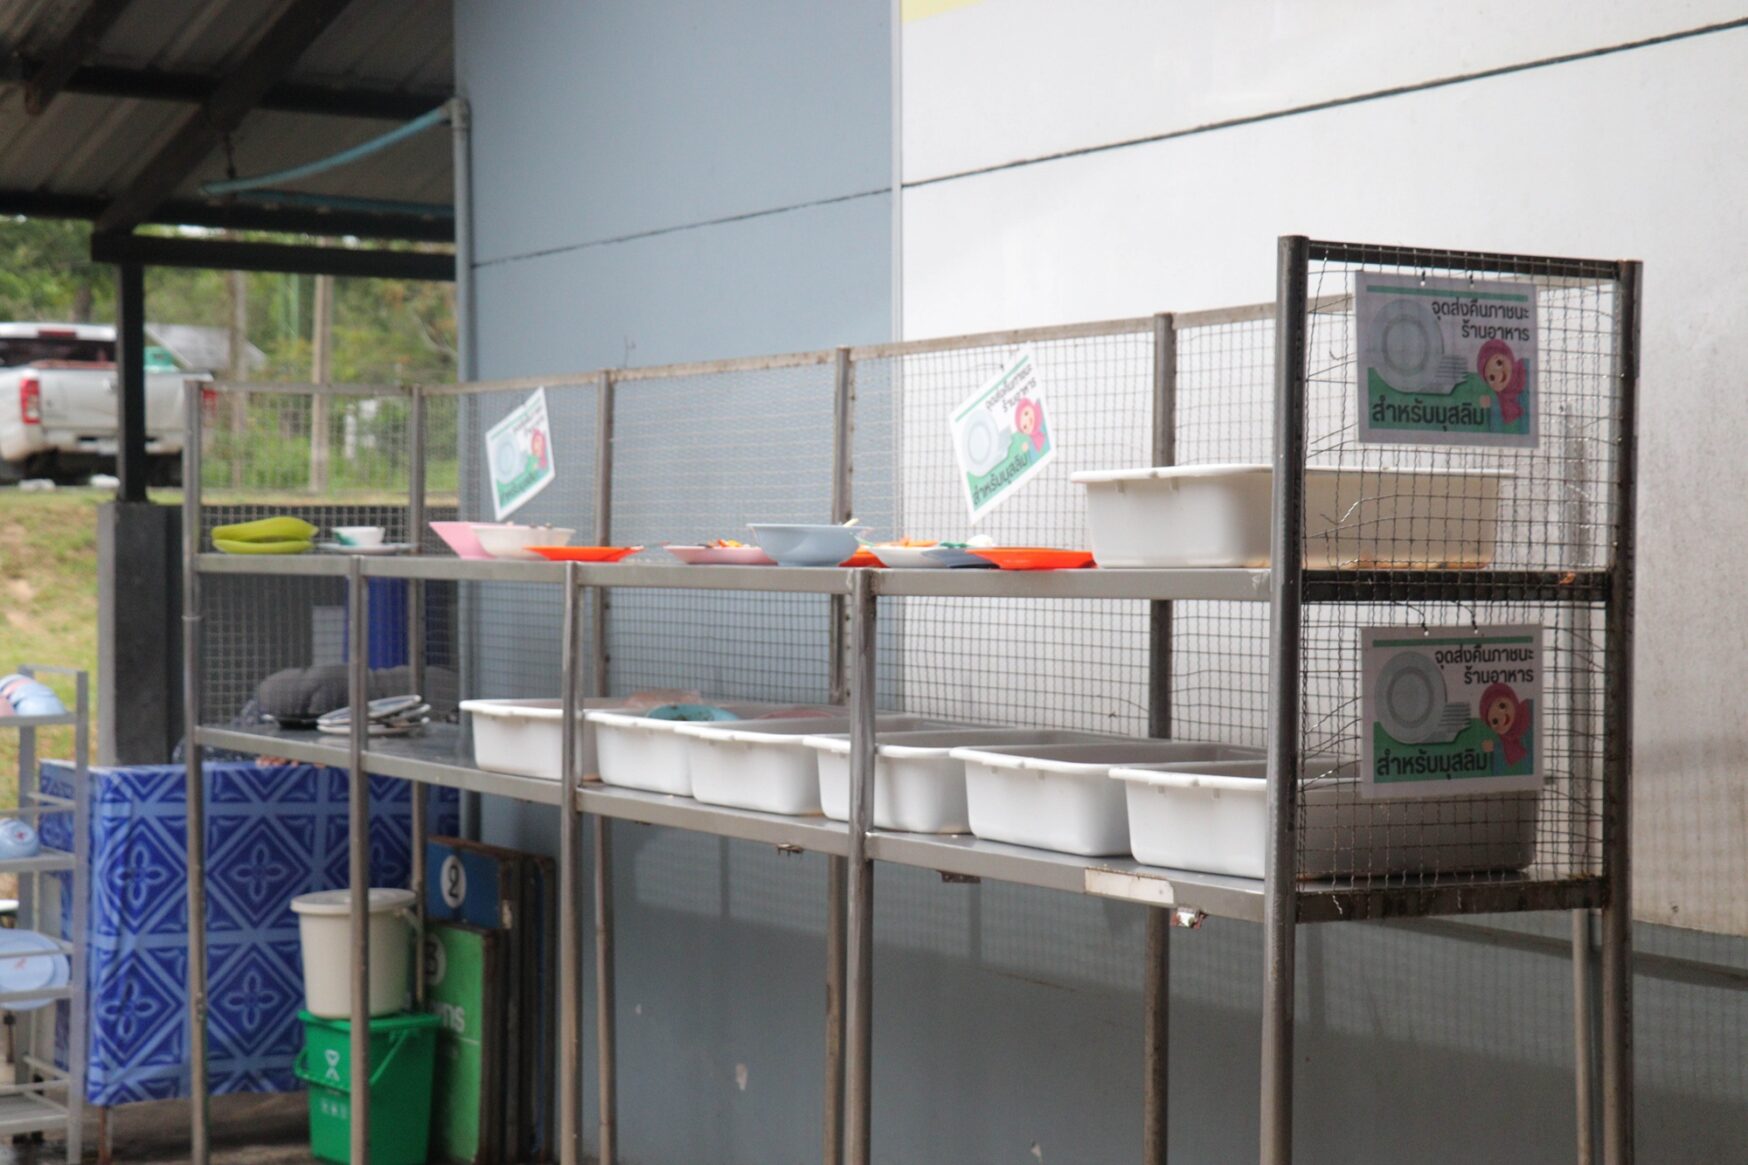
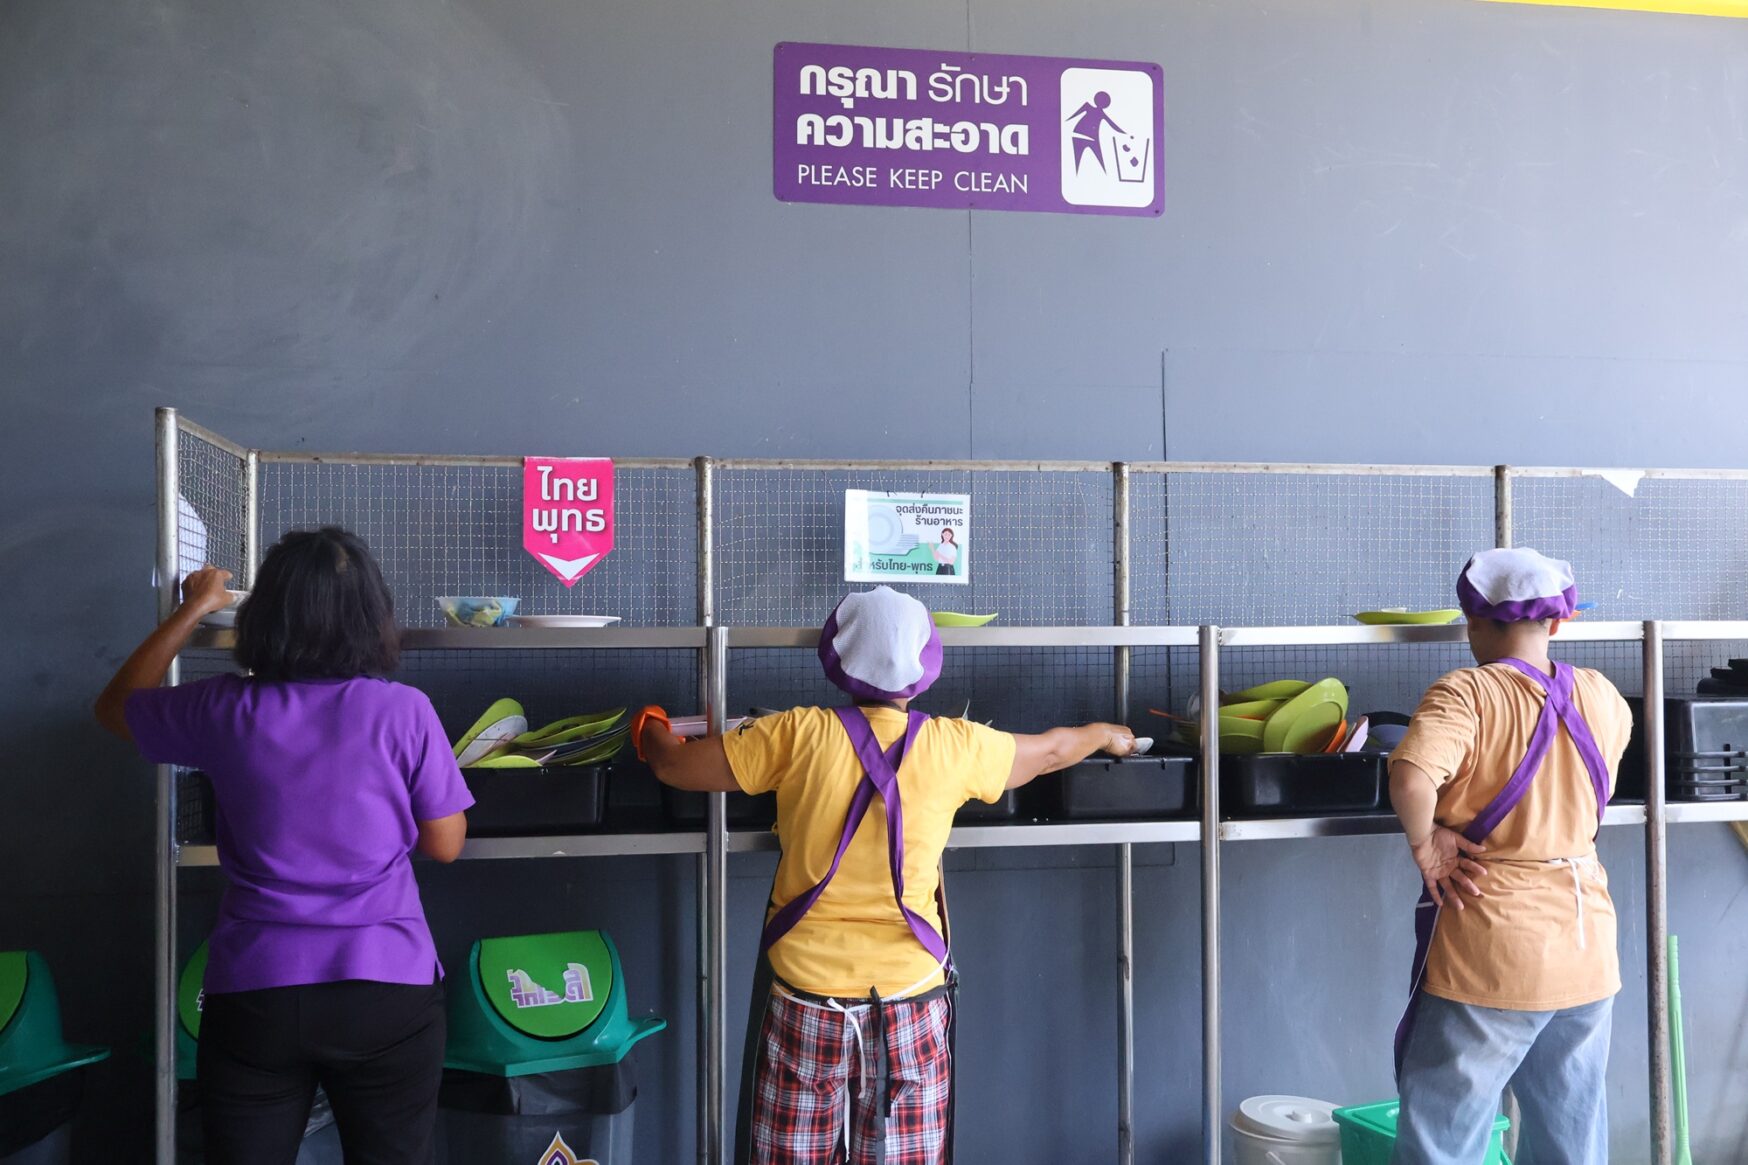
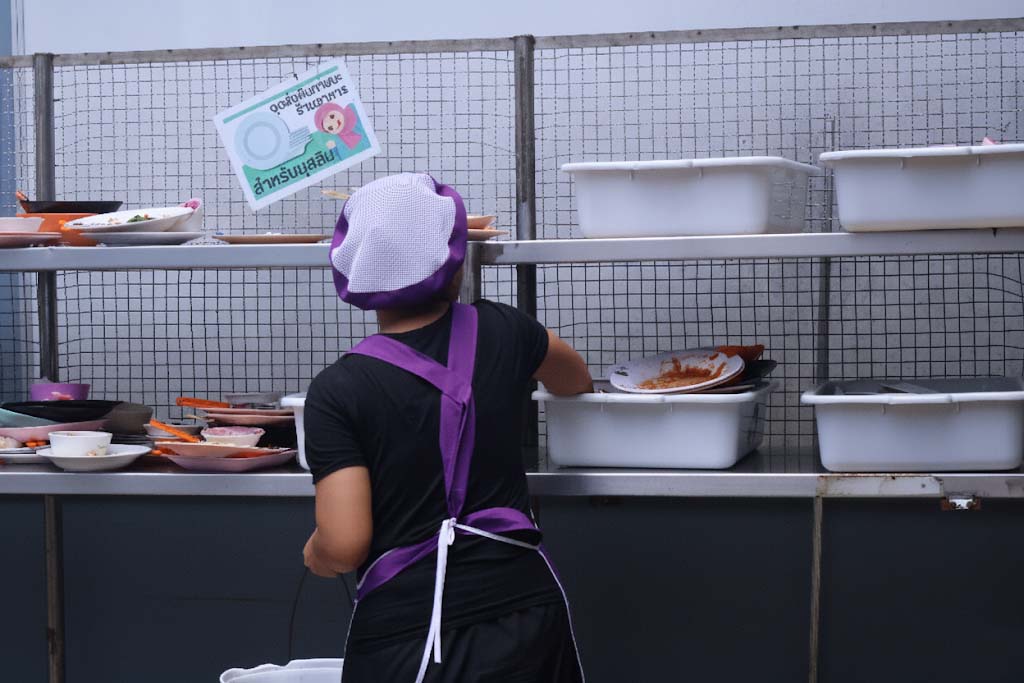
Awareness Campaigns
Although the number of people on campus has increased, leading to higher levels of food consumption, Walailak University has implemented strong measures to reduce food waste. Initiatives include the campaign “Take Just Enough, Reduce Food Waste”, which encourages students and staff engagement to take appropriate portions of food. In addition, posters and other awareness materials have been installed in canteens and food courts to raise awareness and promote behavioral change.
Food Waste Monitoring and Measurement System
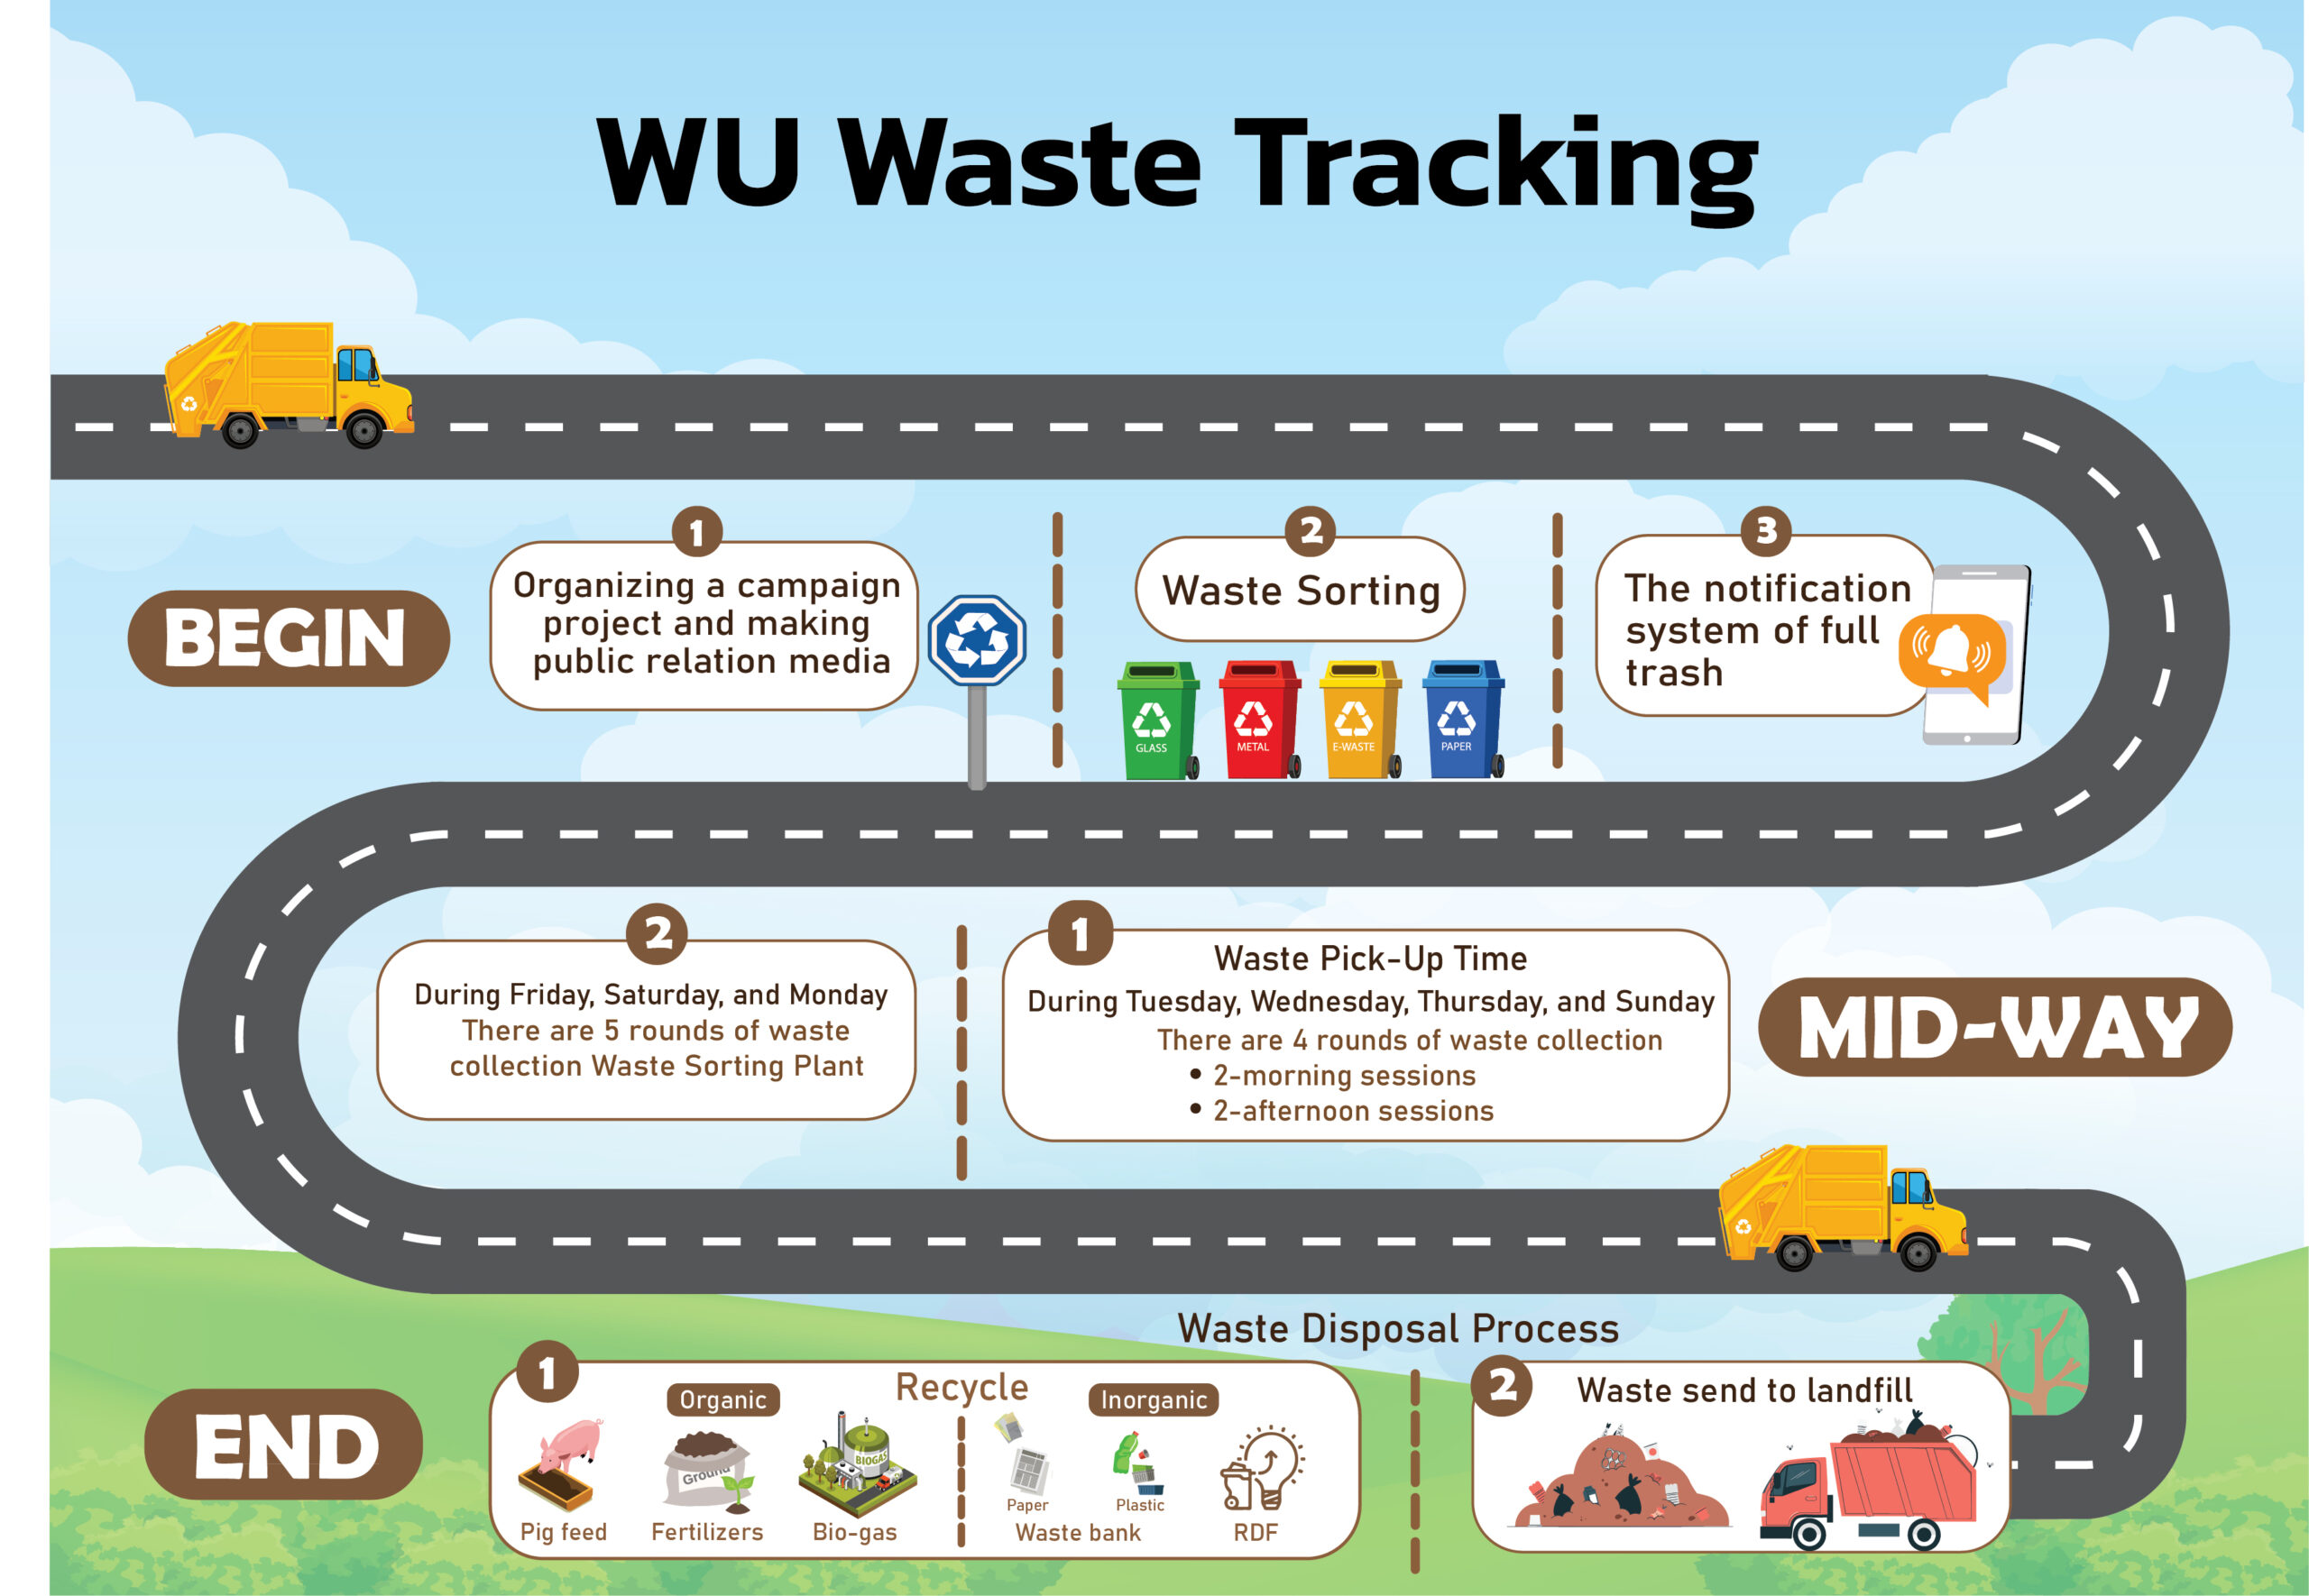
Walailak University has developed a comprehensive and effective food waste monitoring and measurement system. The system operates through three integrated stages—initial, intermediate, and final—ensuring that food waste management is practical and aligned with sustainable best practices
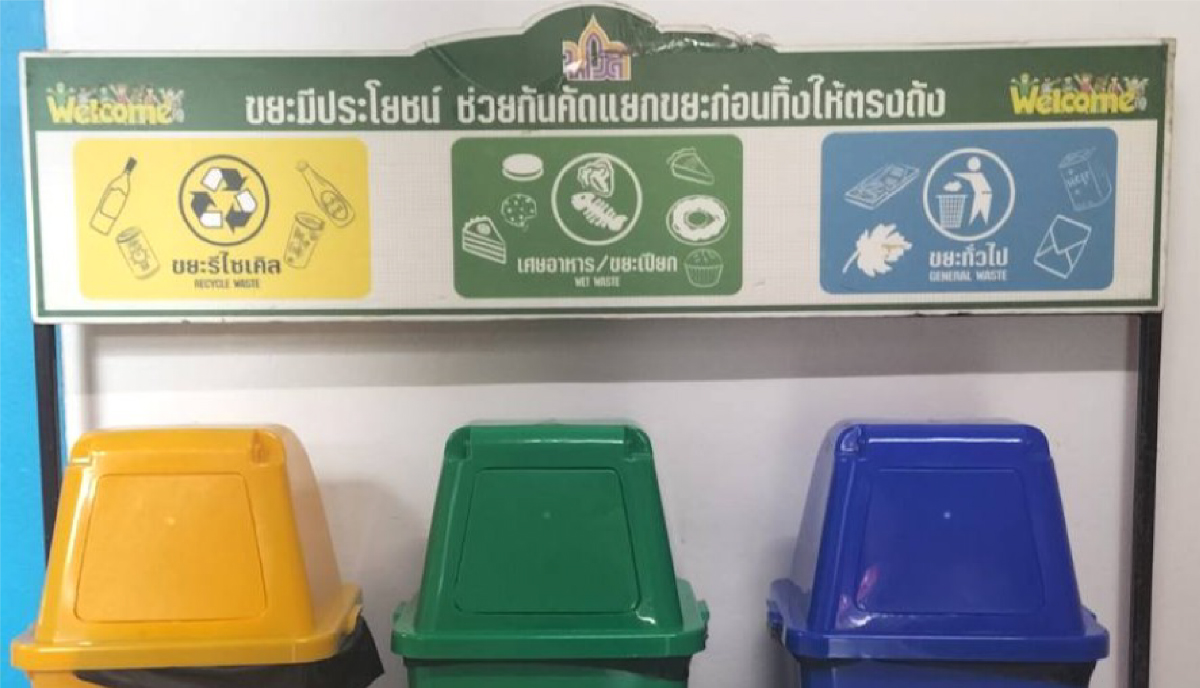
Initial Stage
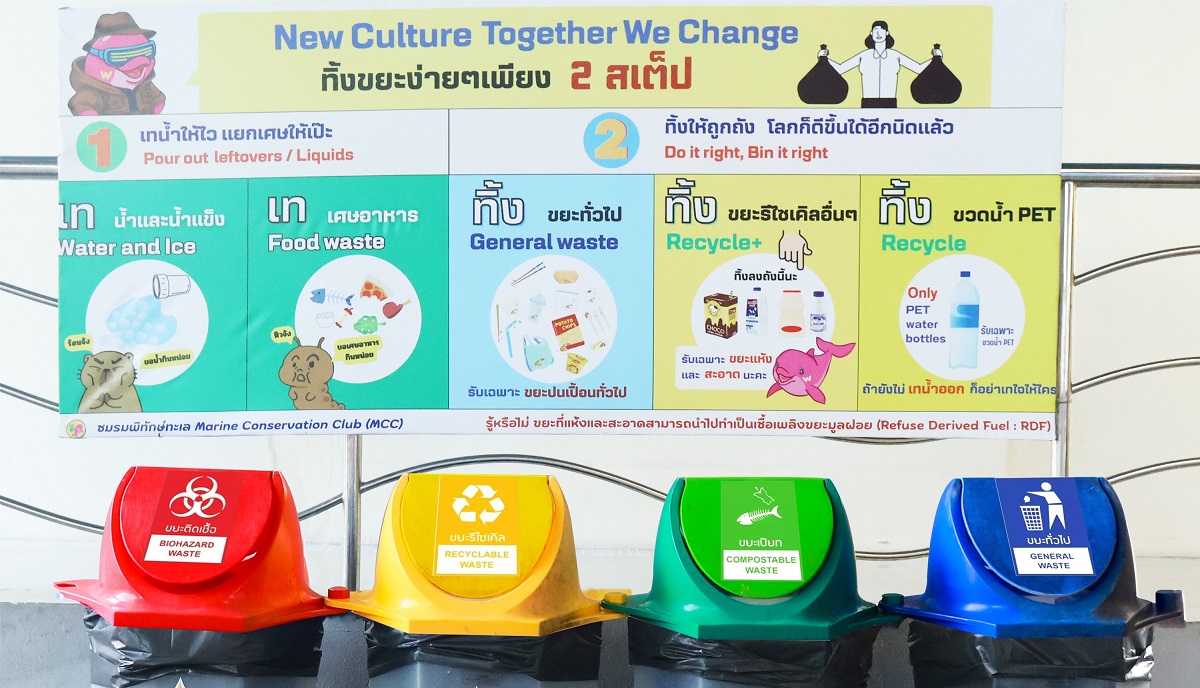
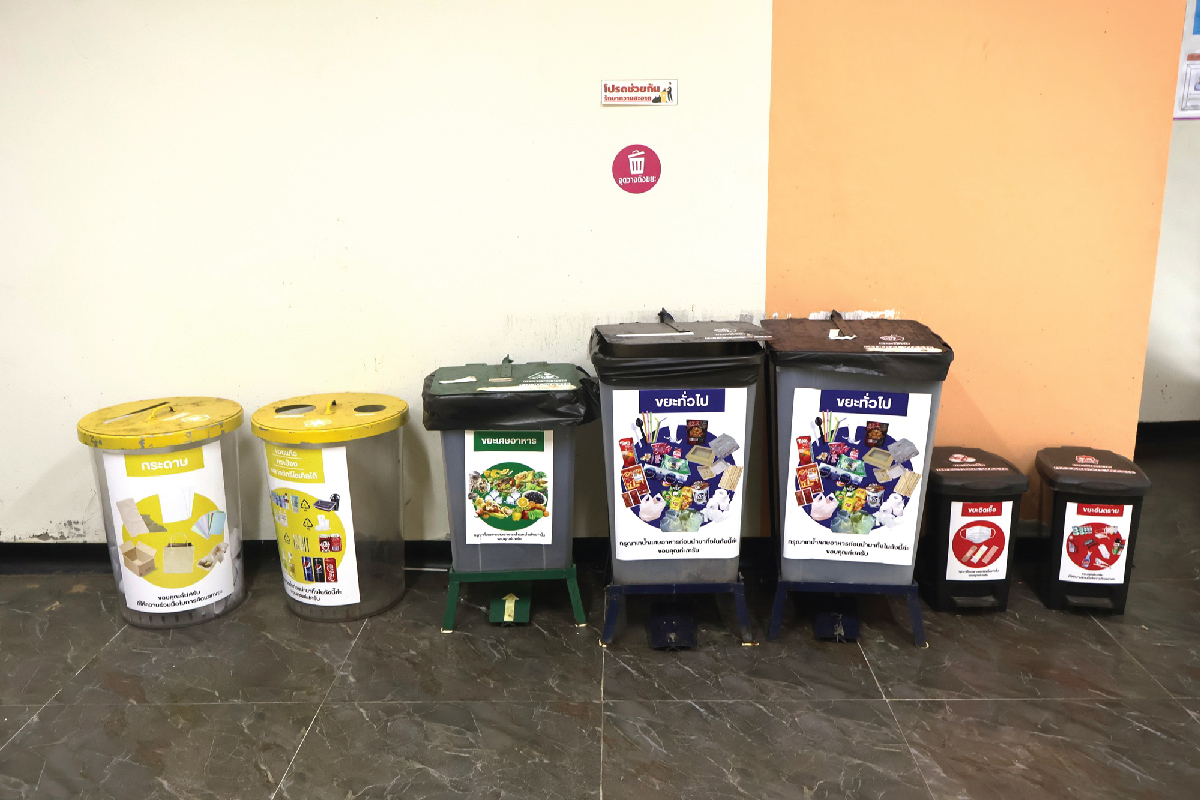
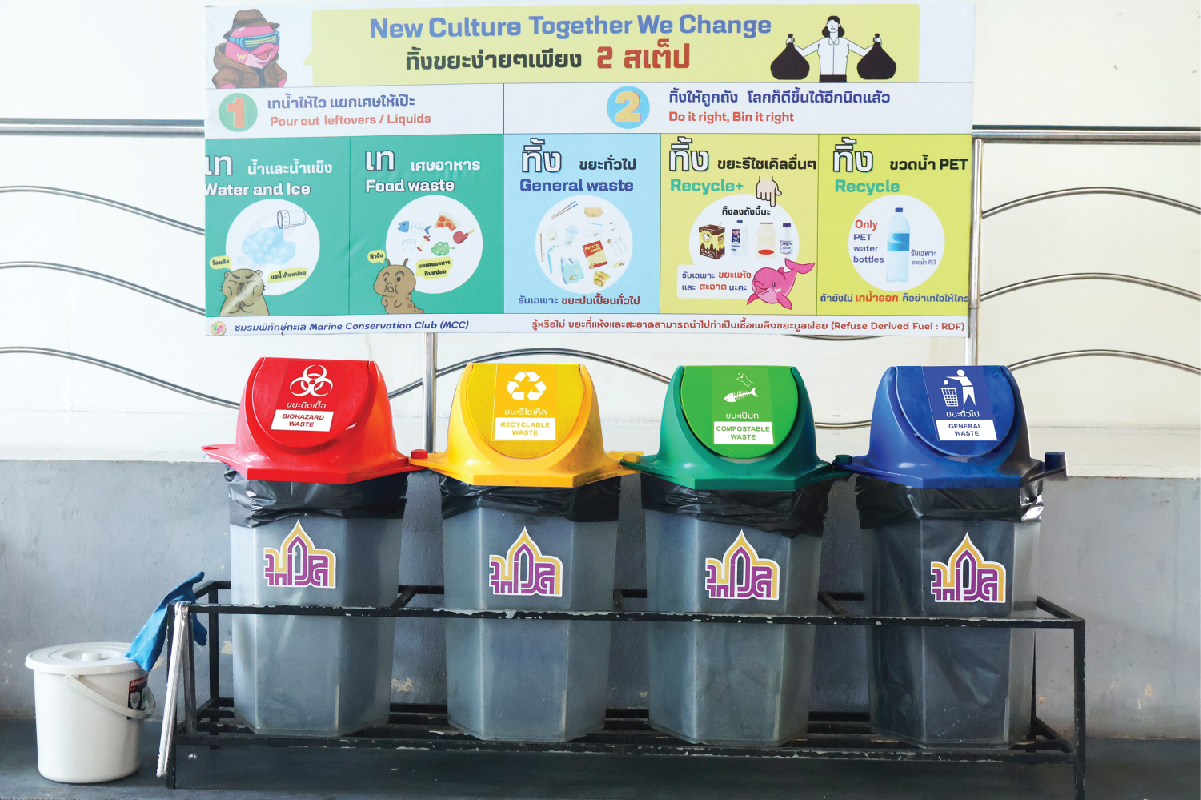
The initial stage focuses on raising awareness and separating food waste at the source. The university organizes campaigns to educate staff and students, promoting appropriate behaviors in handling food waste from the outset. Color-coded bins have been installed throughout the campus to enable effective separation of food waste from other types of waste.
Additionally, a LINE application notification system has been developed to alert staff when bins are full, allowing timely waste collection and preventing accumulation that could cause odors or environmental problems.
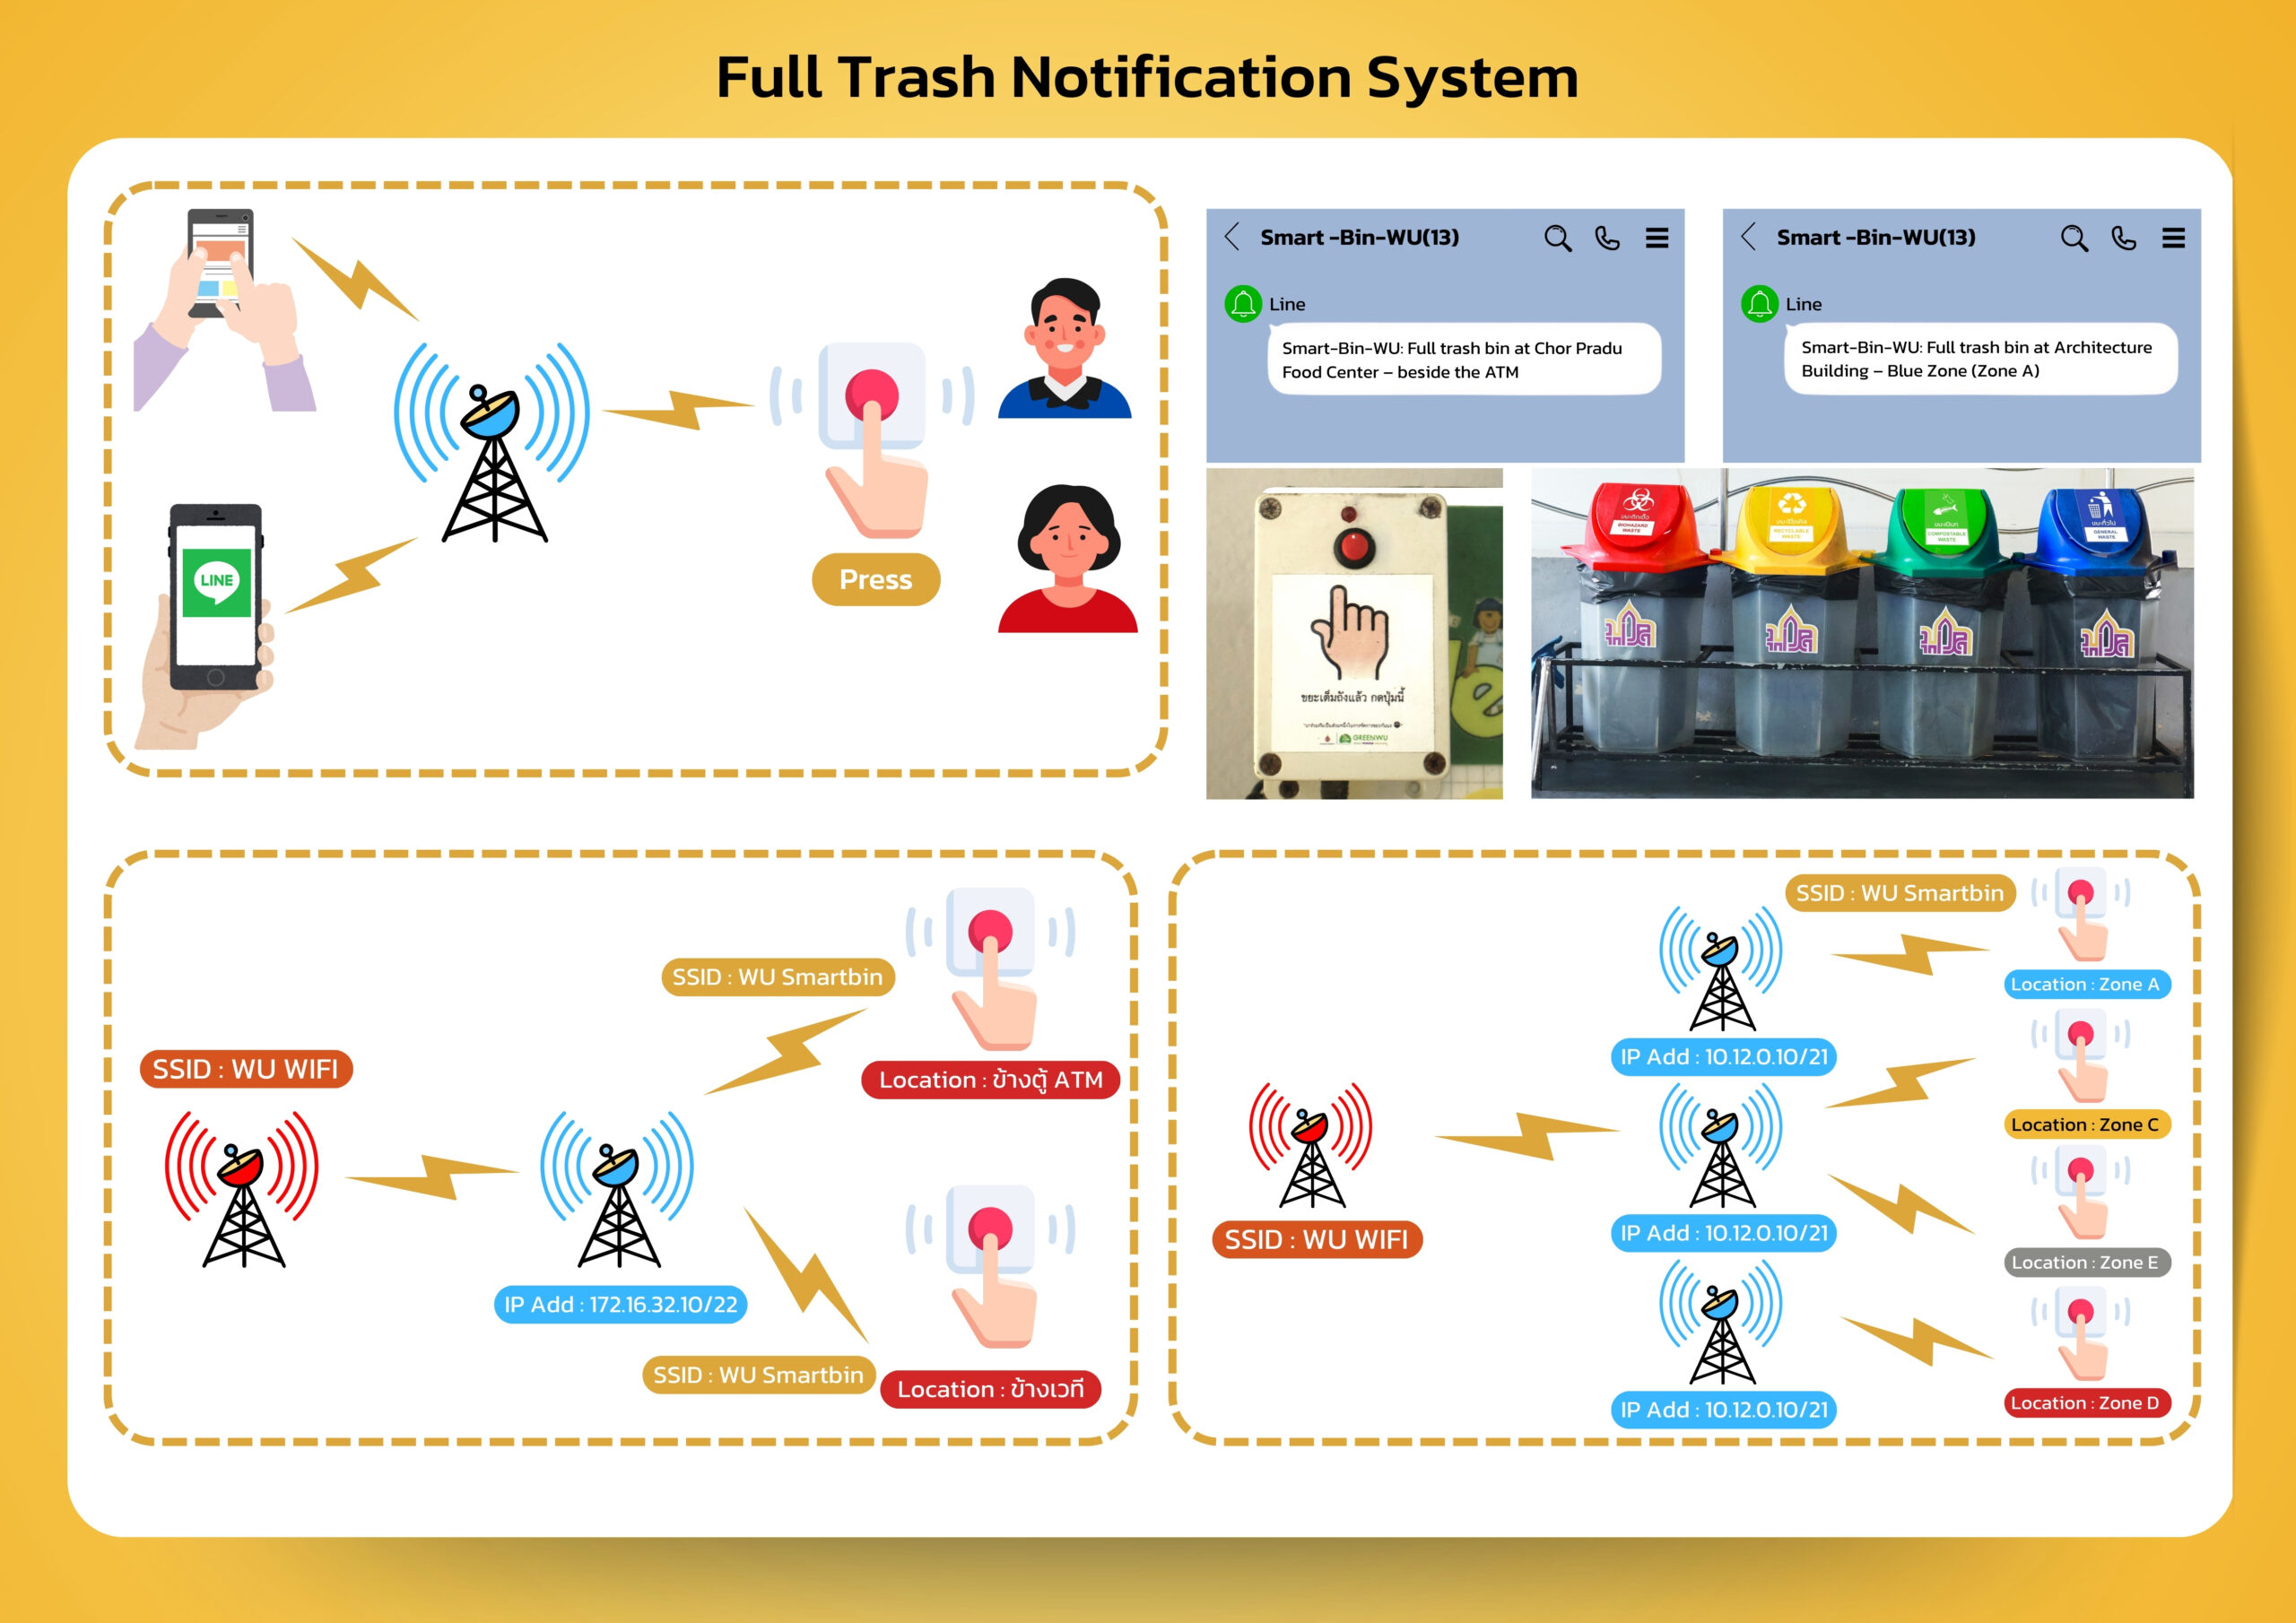
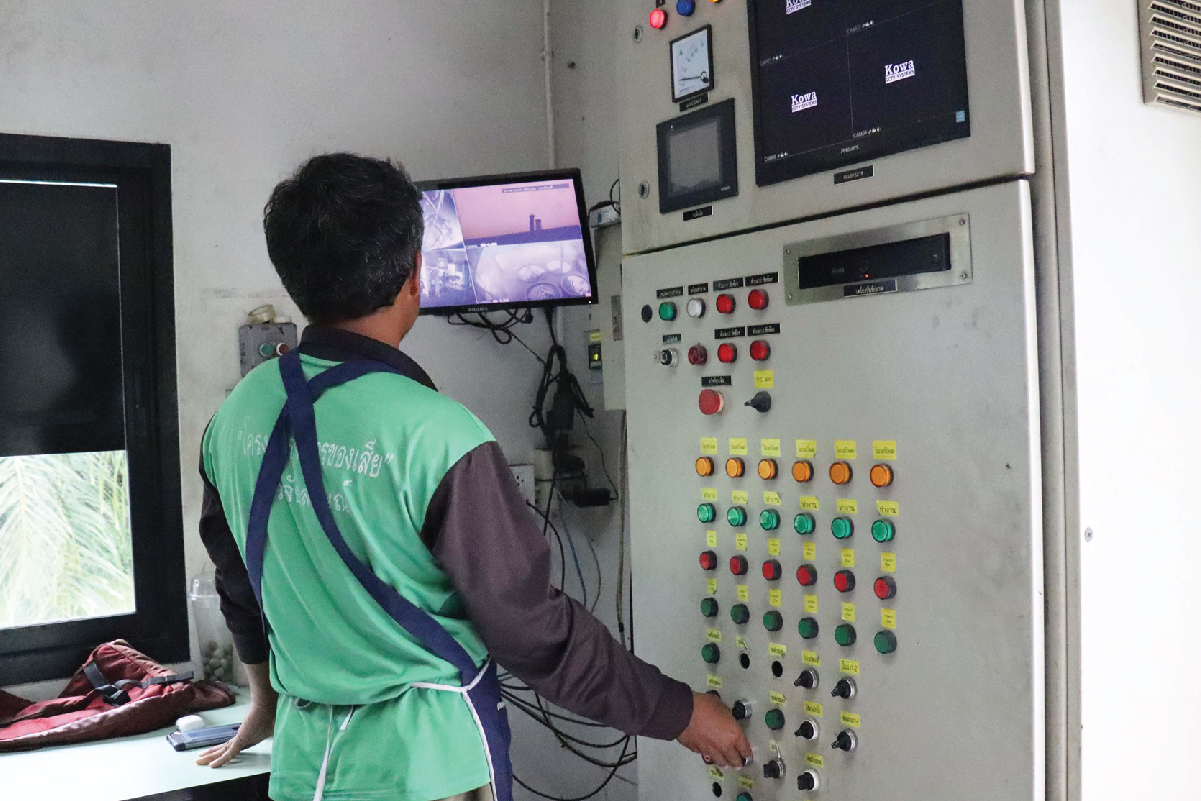
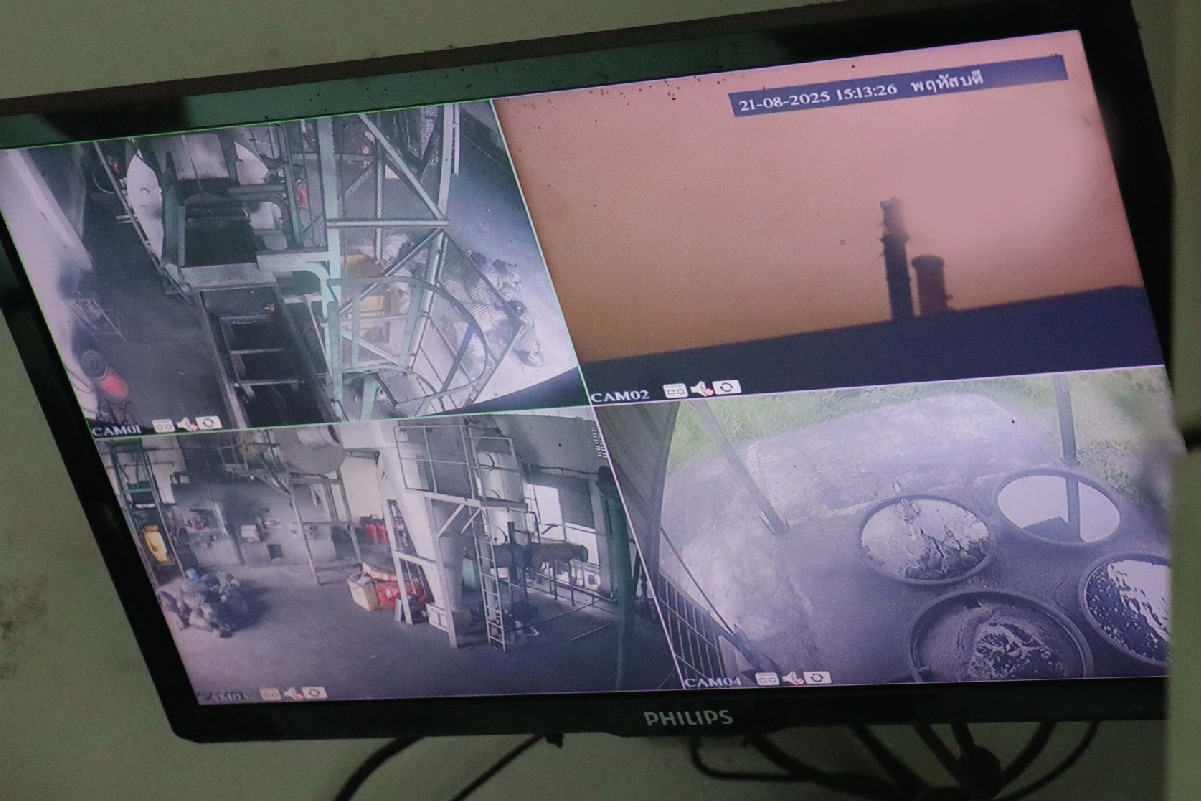
Full Trash Notification System
The full trash notification system uses sensors to detect the amount of waste in bins. When the waste reaches a specified level, the system sends an alert via a mobile application to the staff in charge, enabling timely waste collection. This helps prevent overflowing bins, unpleasant odors, and improves the efficiency of waste management.
The system is particularly beneficial for addressing the problem of overflowing trash, as it provides real-time information on bin status and prevents waste from spilling over and causing issues. By ensuring prompt collection, it reduces foul odors and enhances cleanliness across the university. Moreover, staff can plan collection routes more effectively, minimizing unnecessary trips.
Intermediate Stage
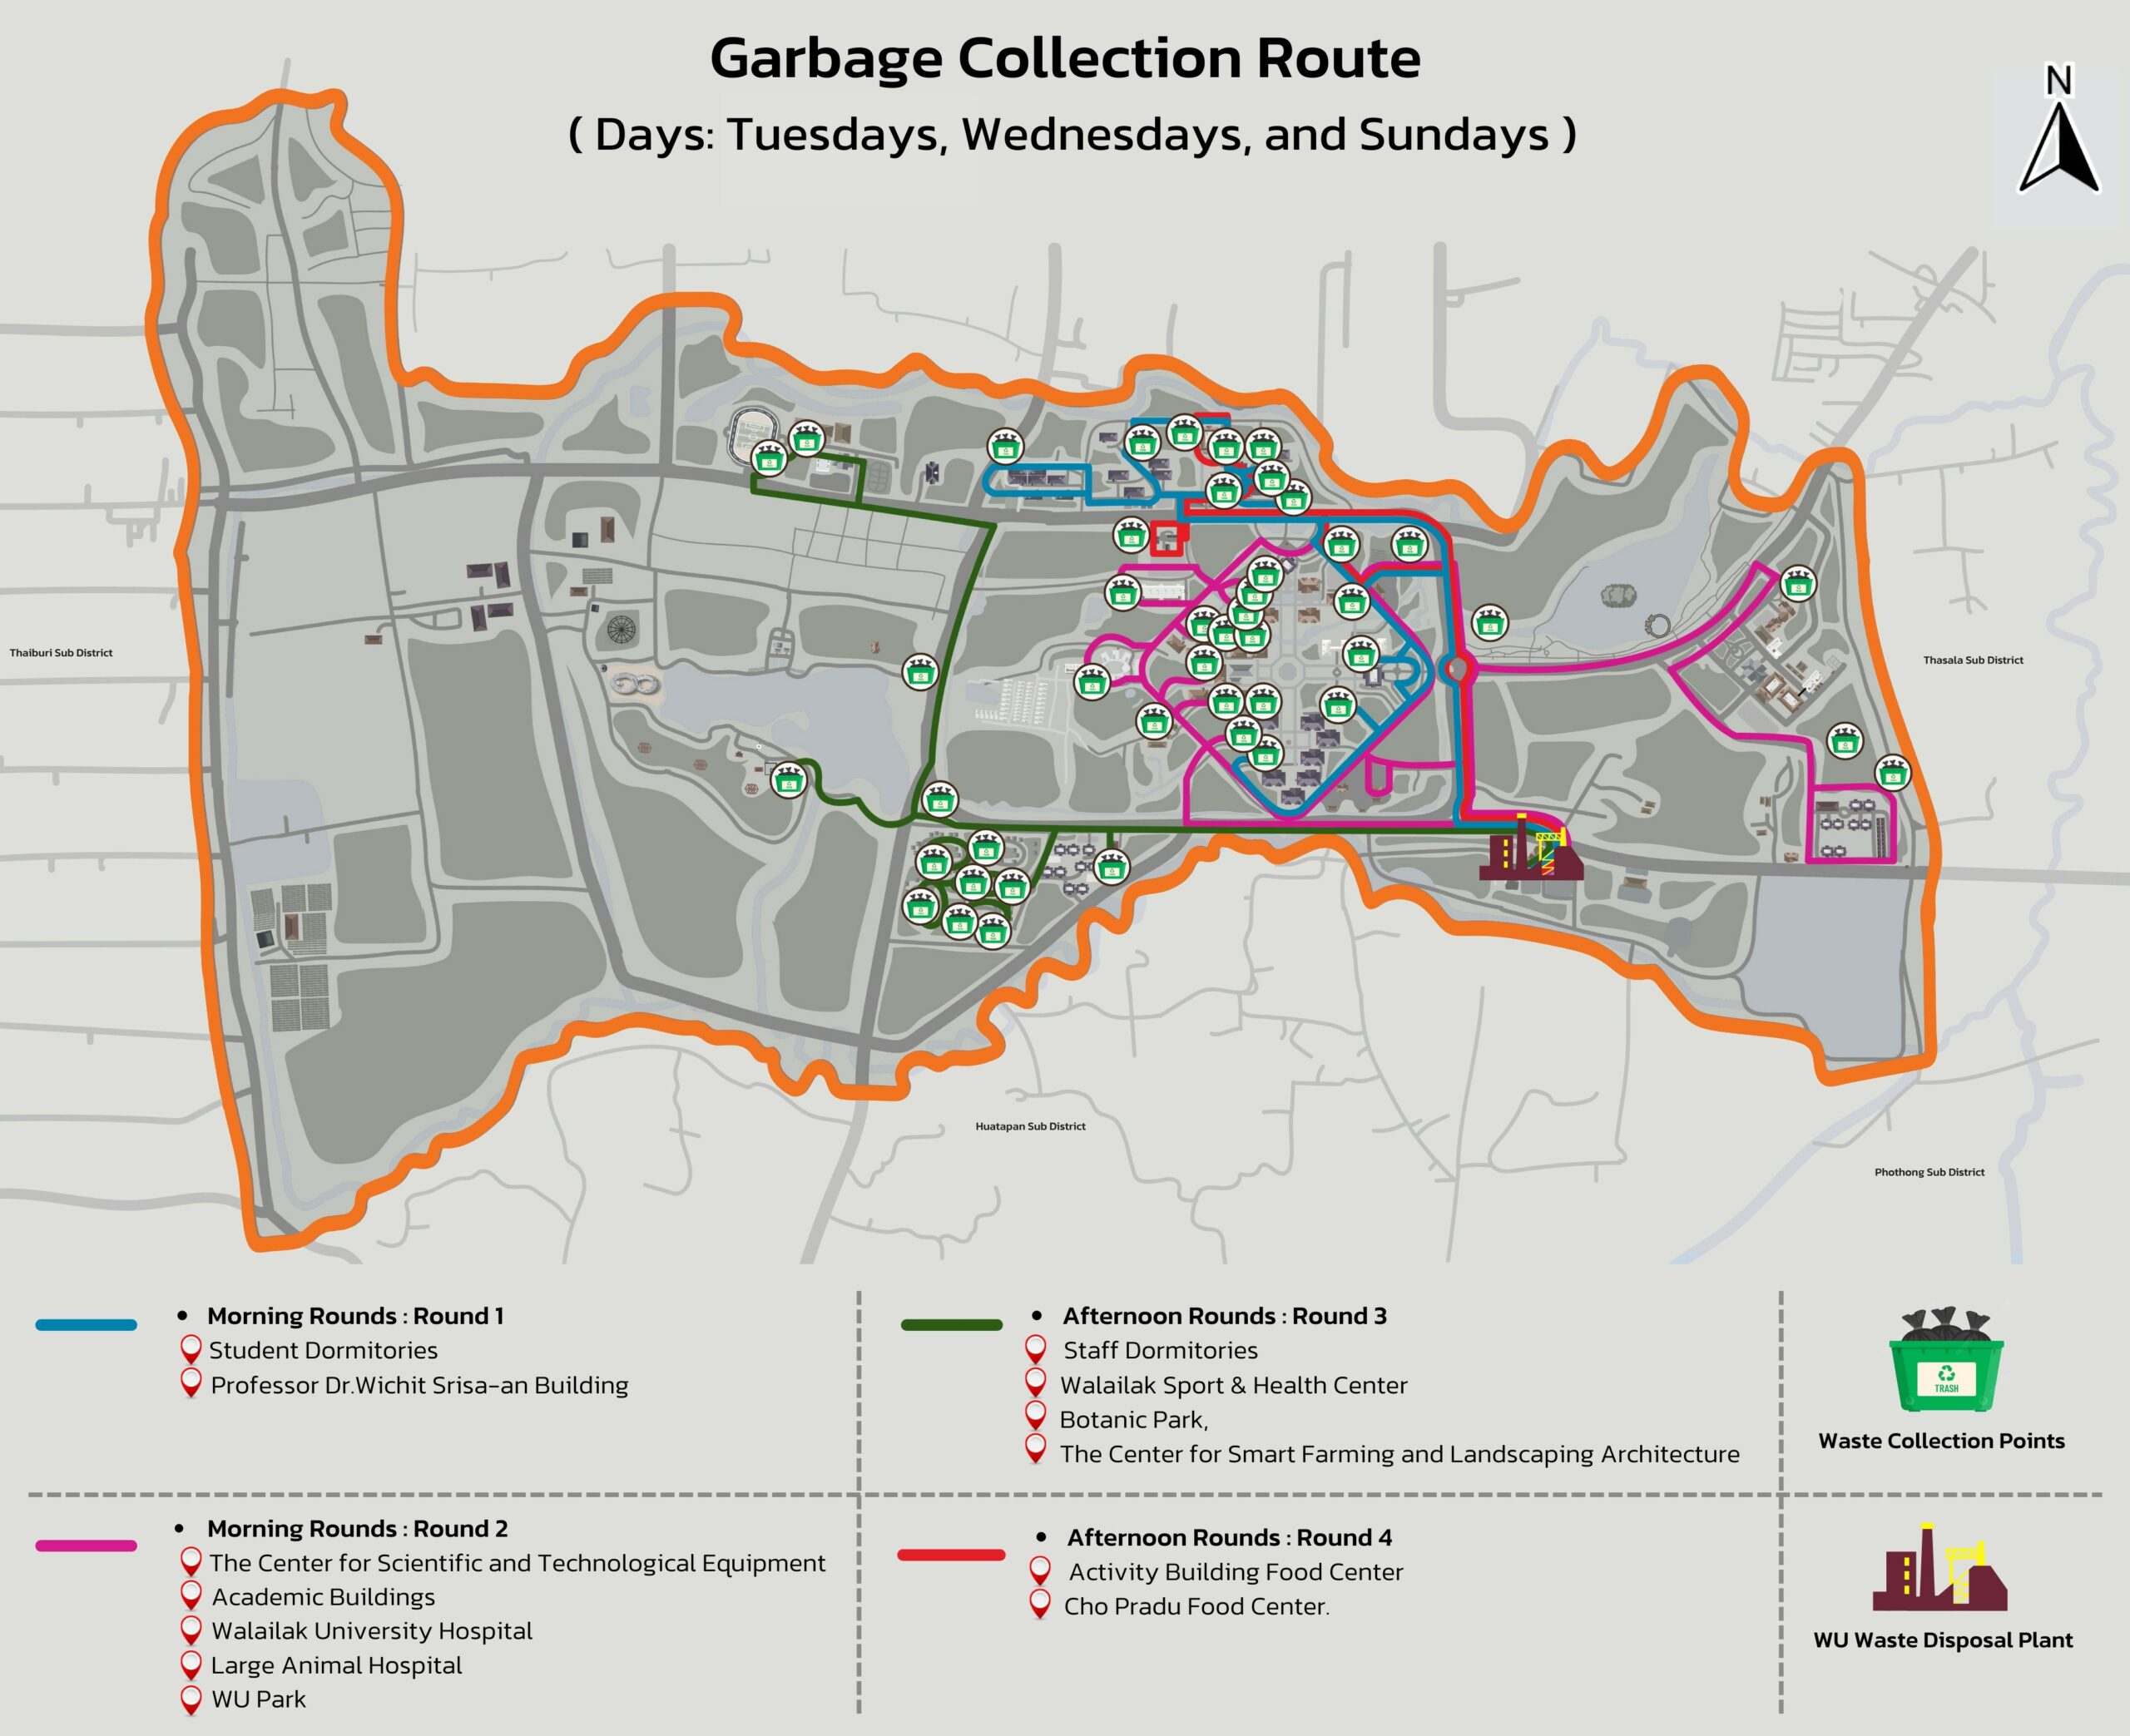
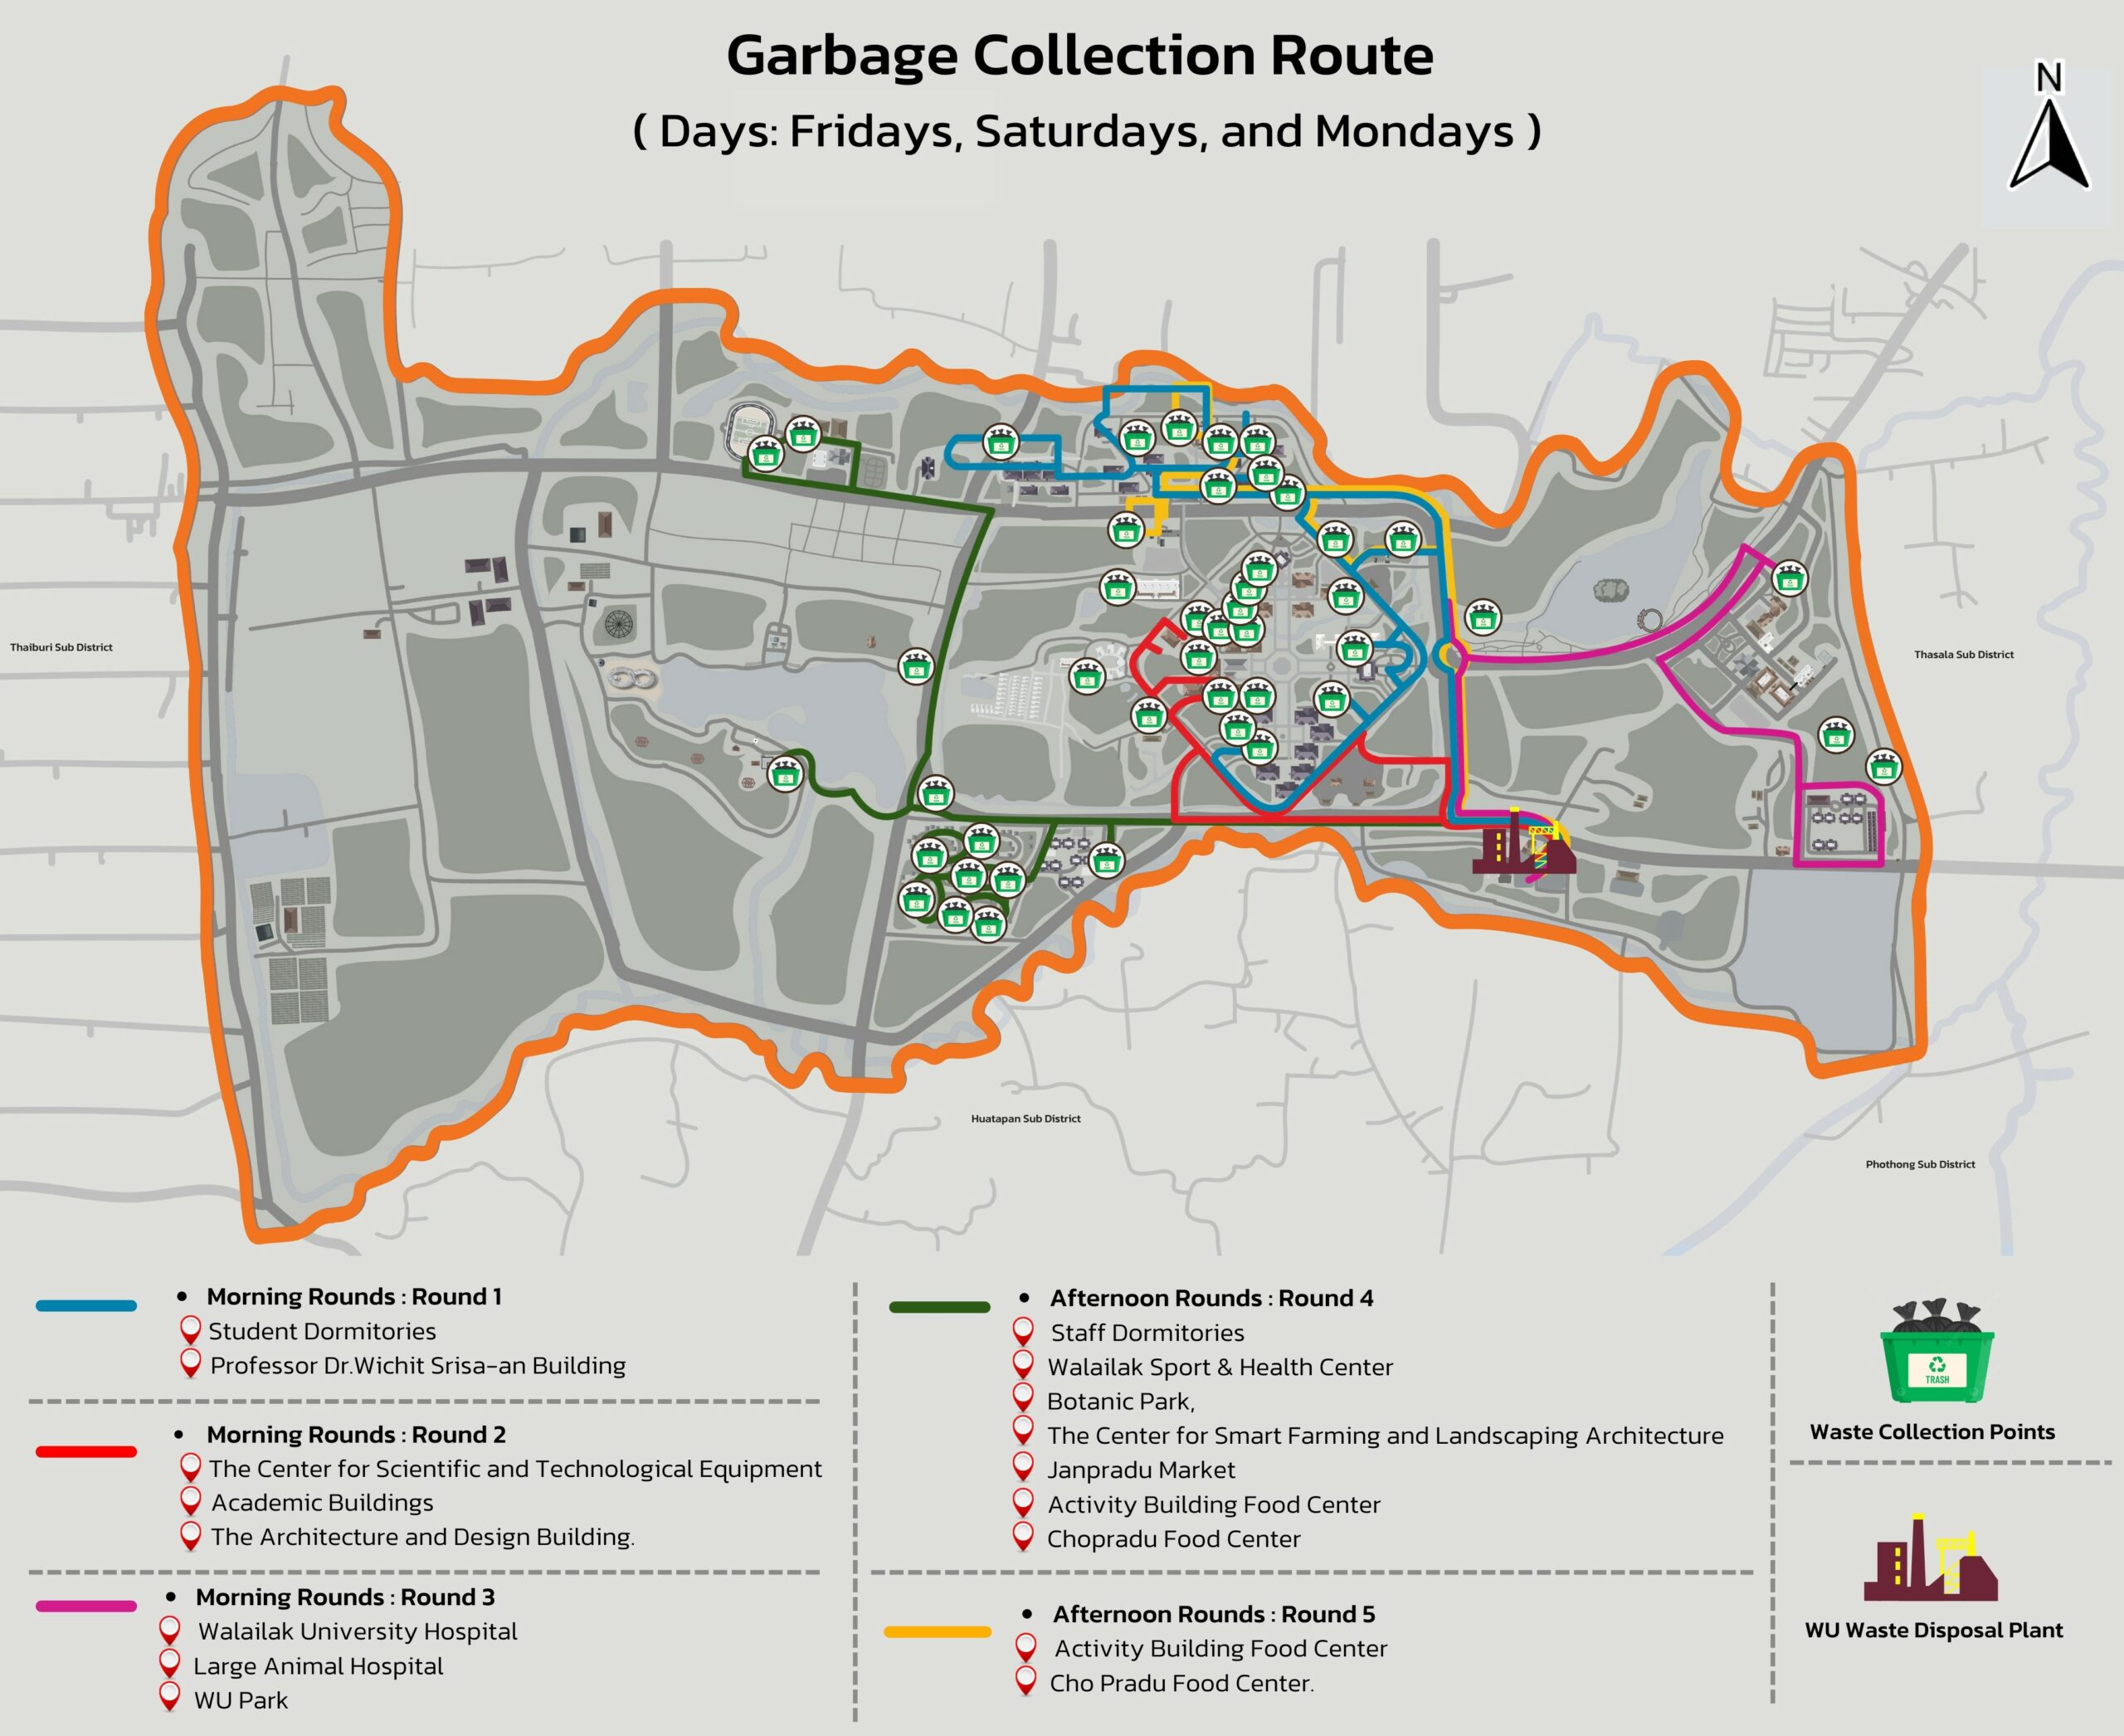
The intermediate stage involves the collection and recording of food waste data, which is essential for analyzing trends and planning long-term waste management strategies. The university has set a clear schedule for food waste collection from main collection points across campus. Waste is collected weekly by garbage trucks, divided into two primary rounds:
Tuesday, Wednesday, and Sunday (4 collection rounds in total)
Friday, Saturday, and Monday (5 collection rounds in total
The amount of food waste collected in each round is systematically recorded on a monthly basis. This data is then used for evaluation and to improve the efficiency of the waste management process.
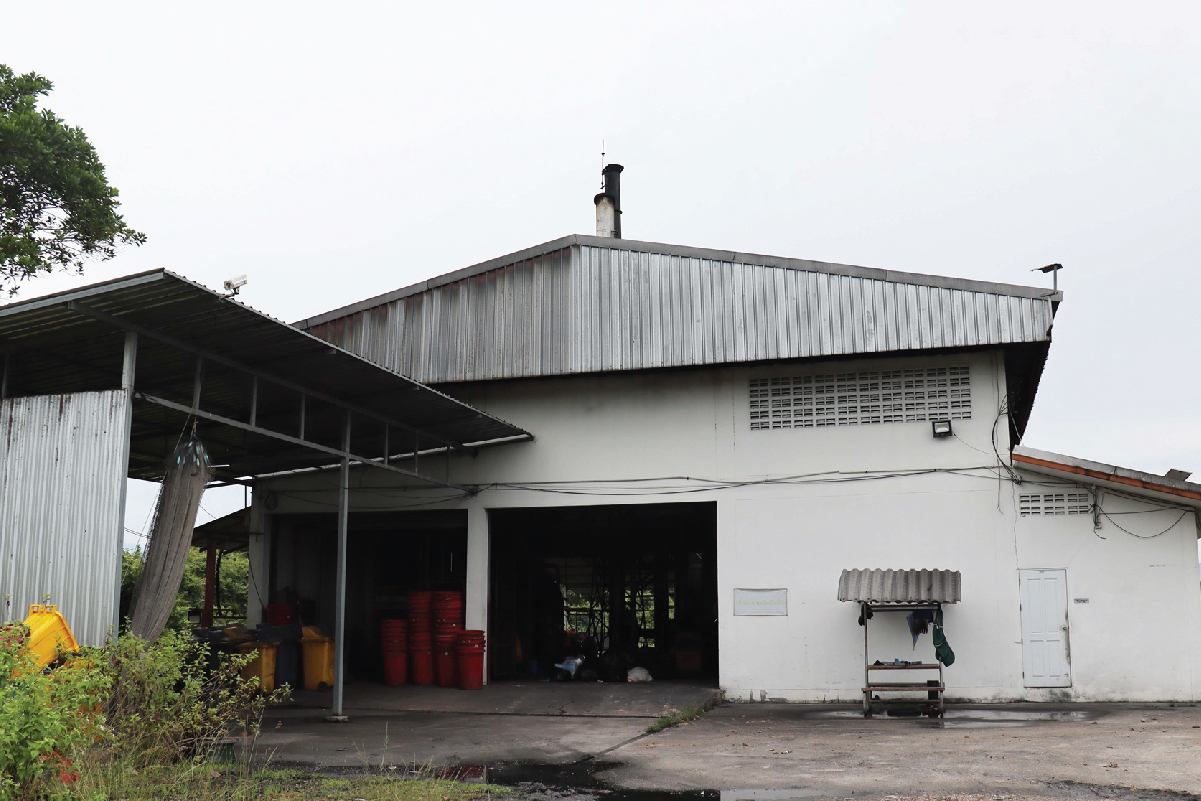
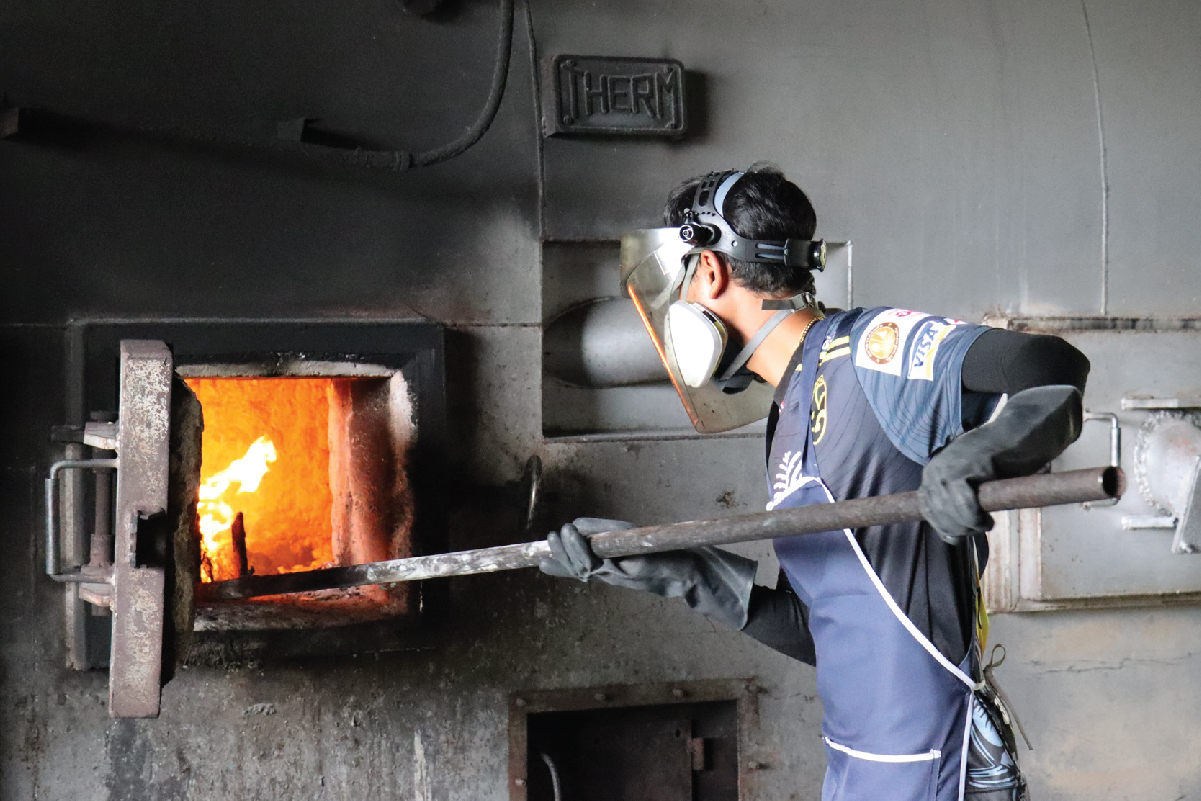
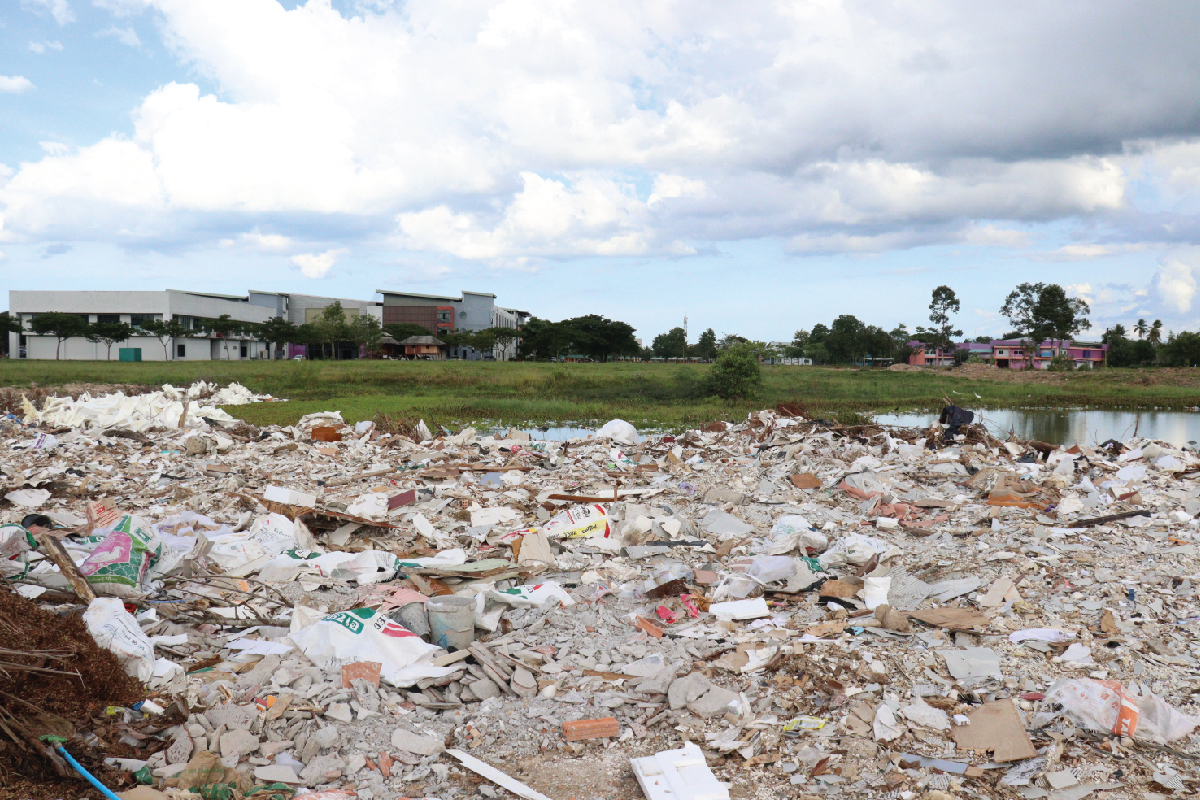
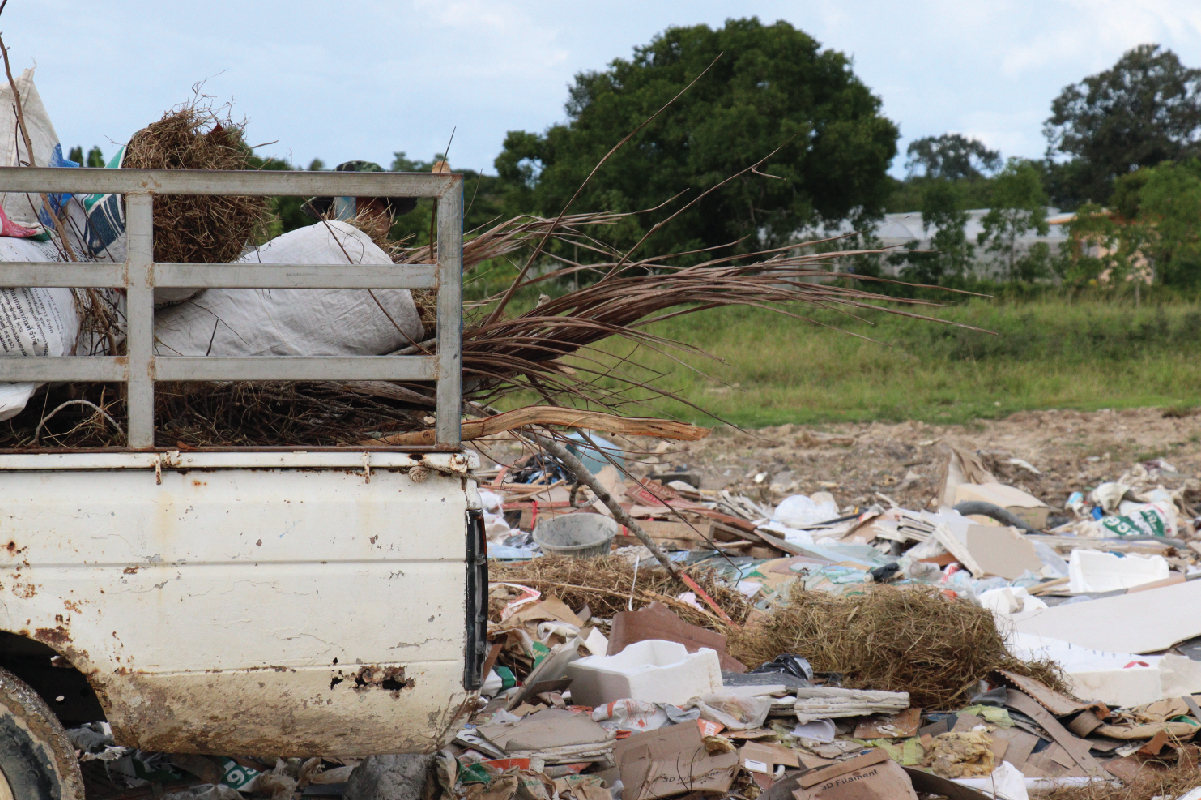
Final Stage
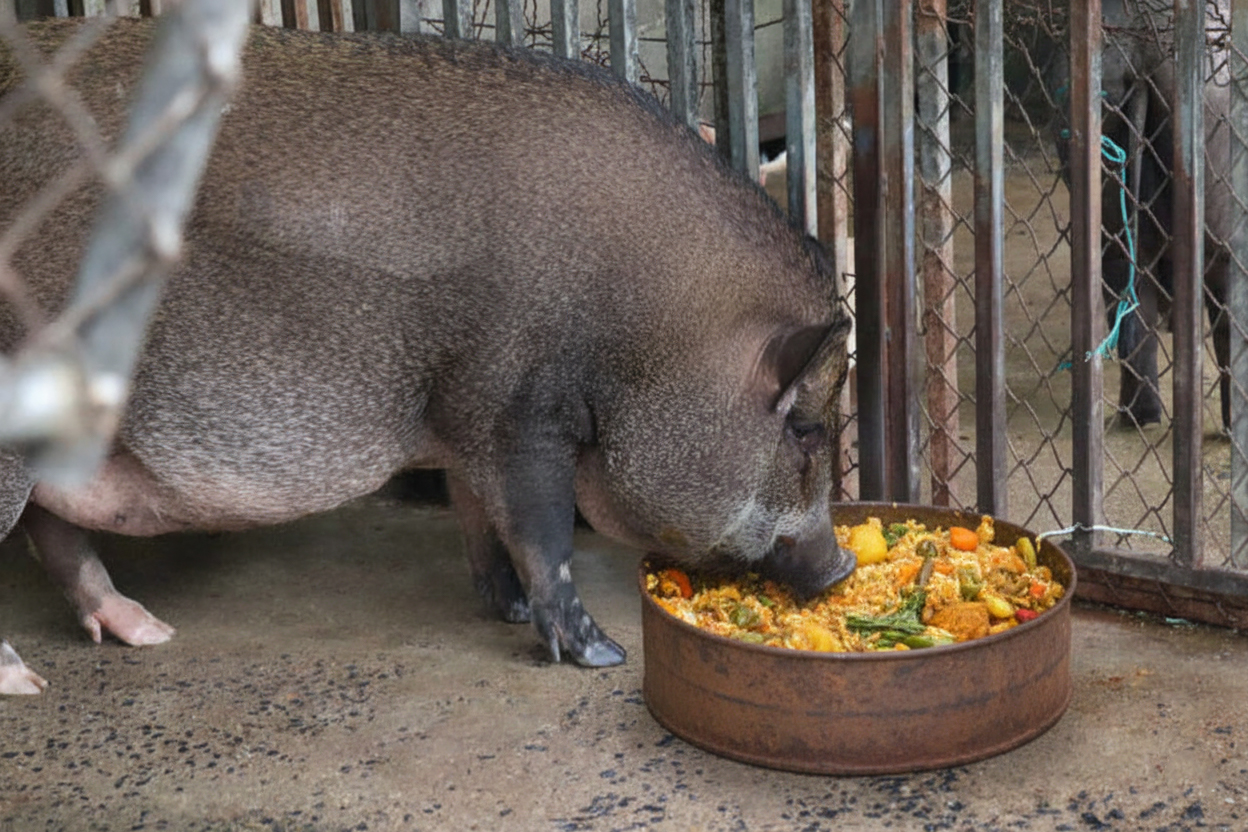
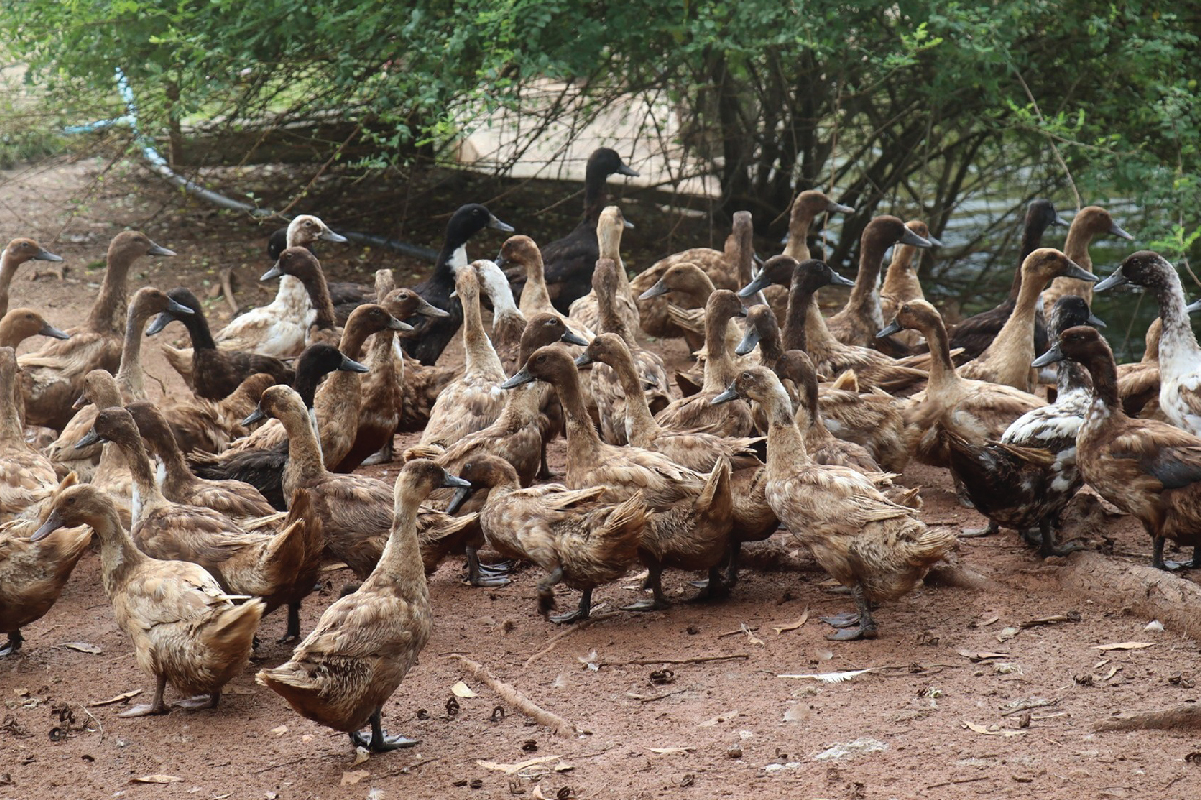
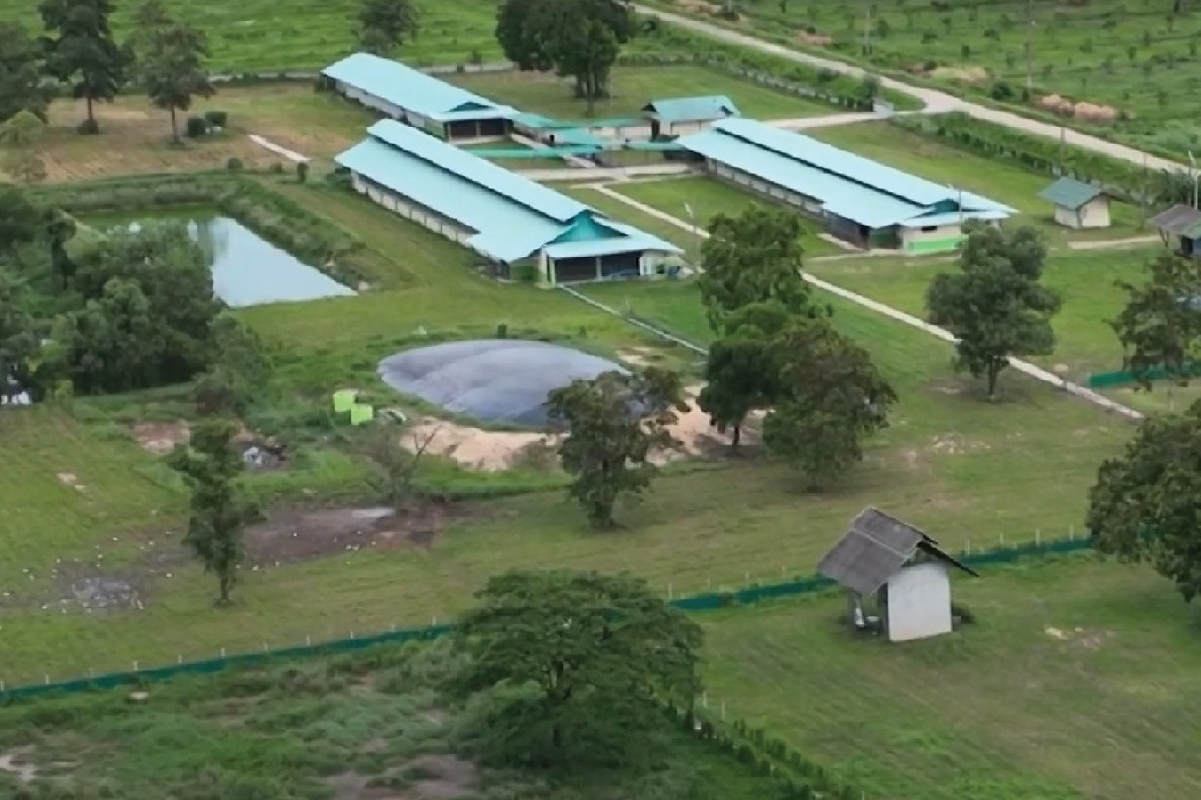
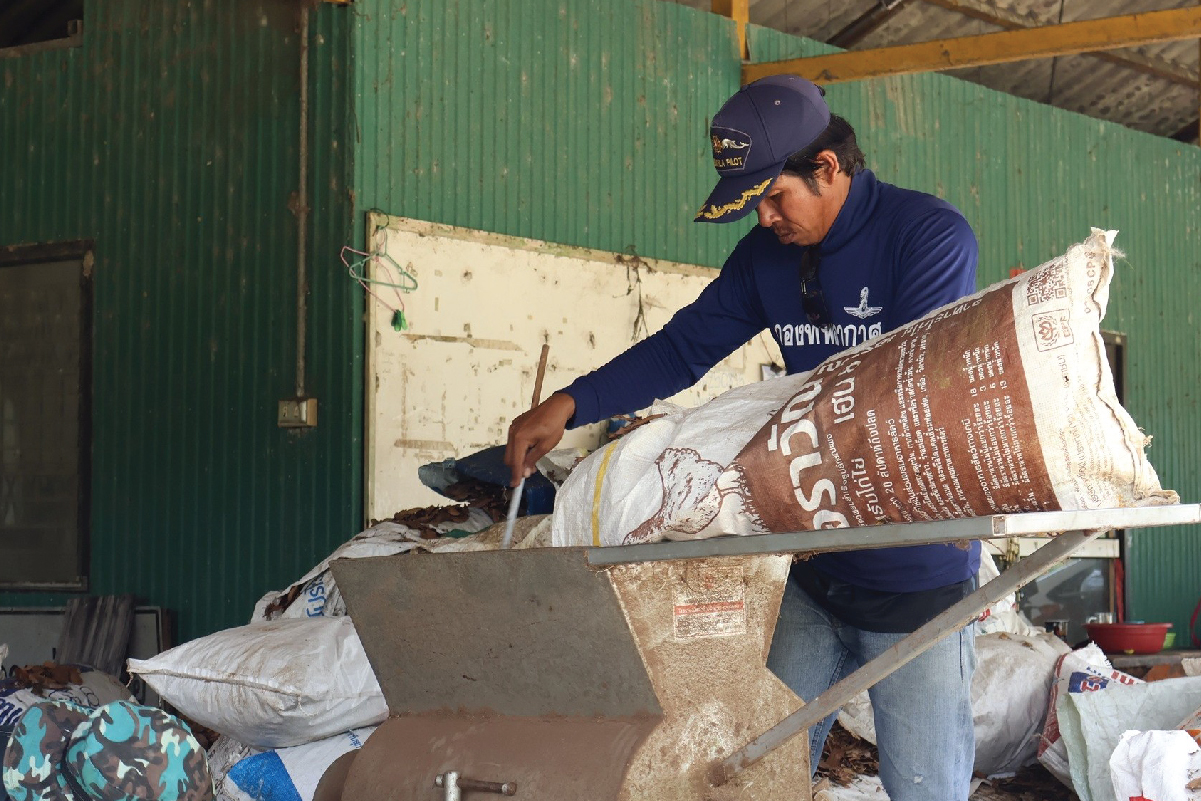
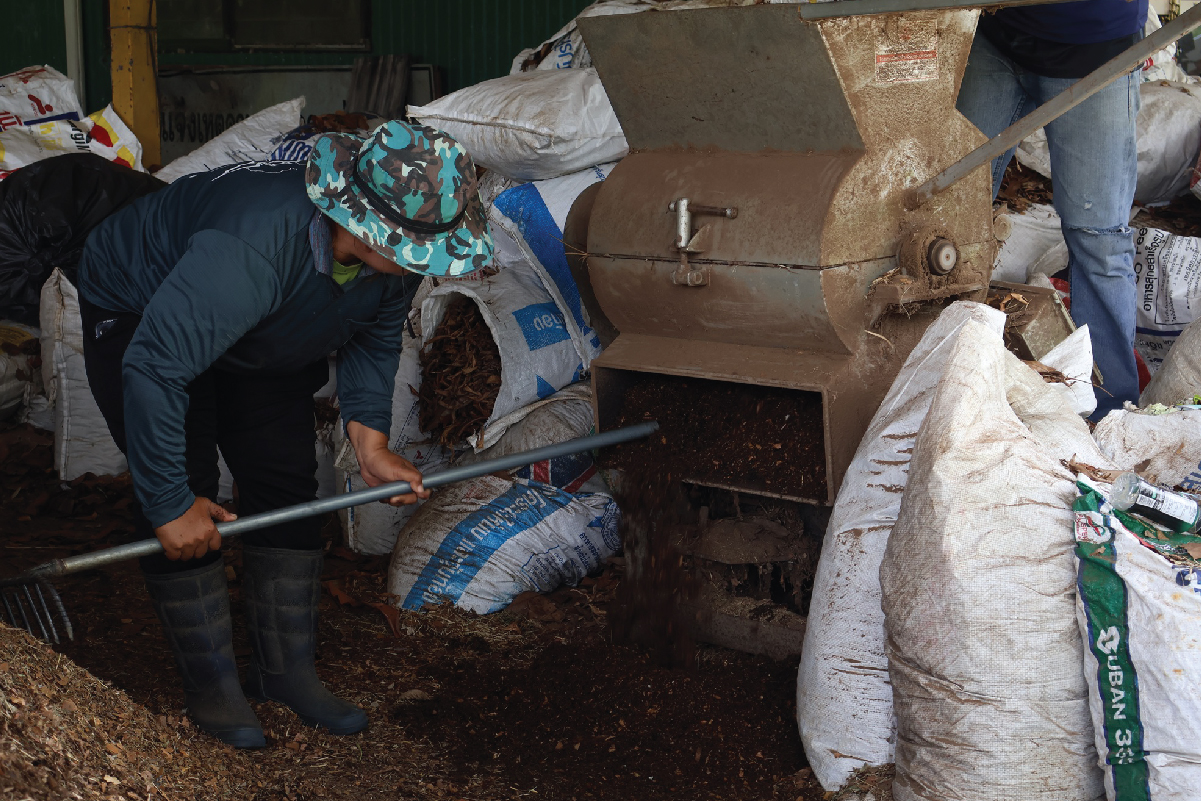
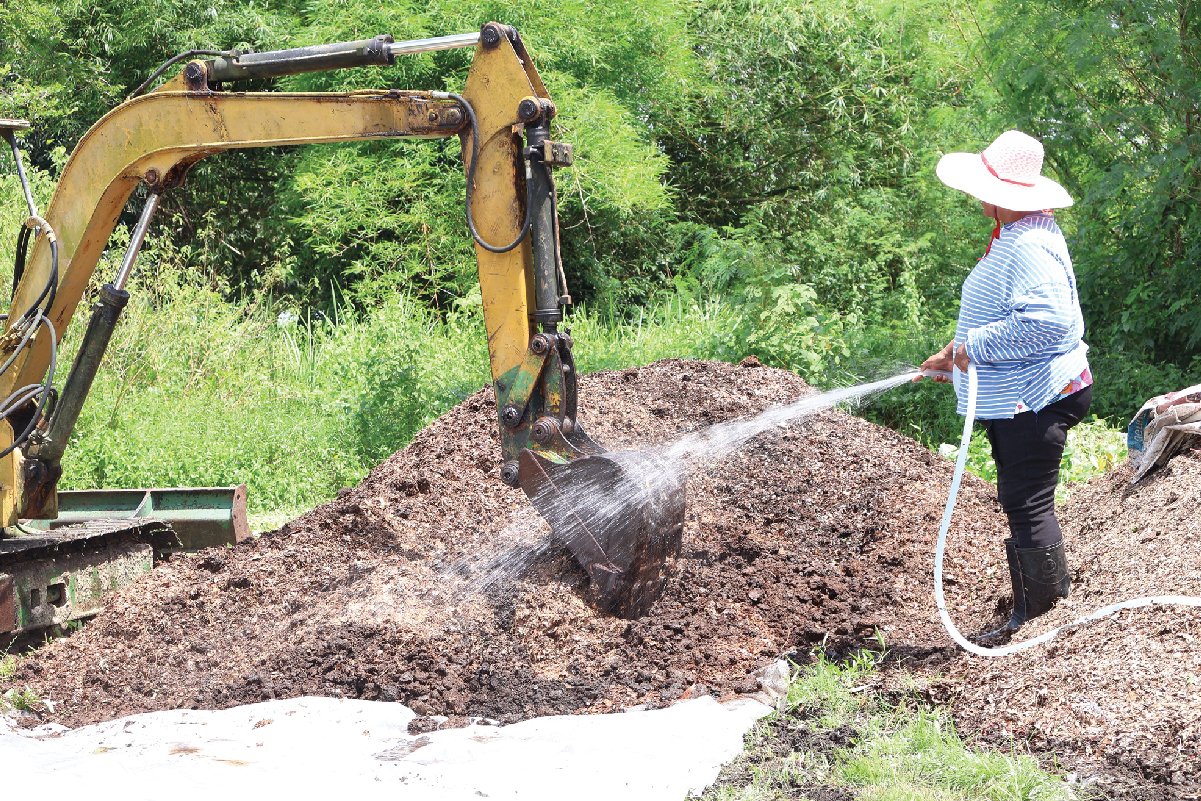
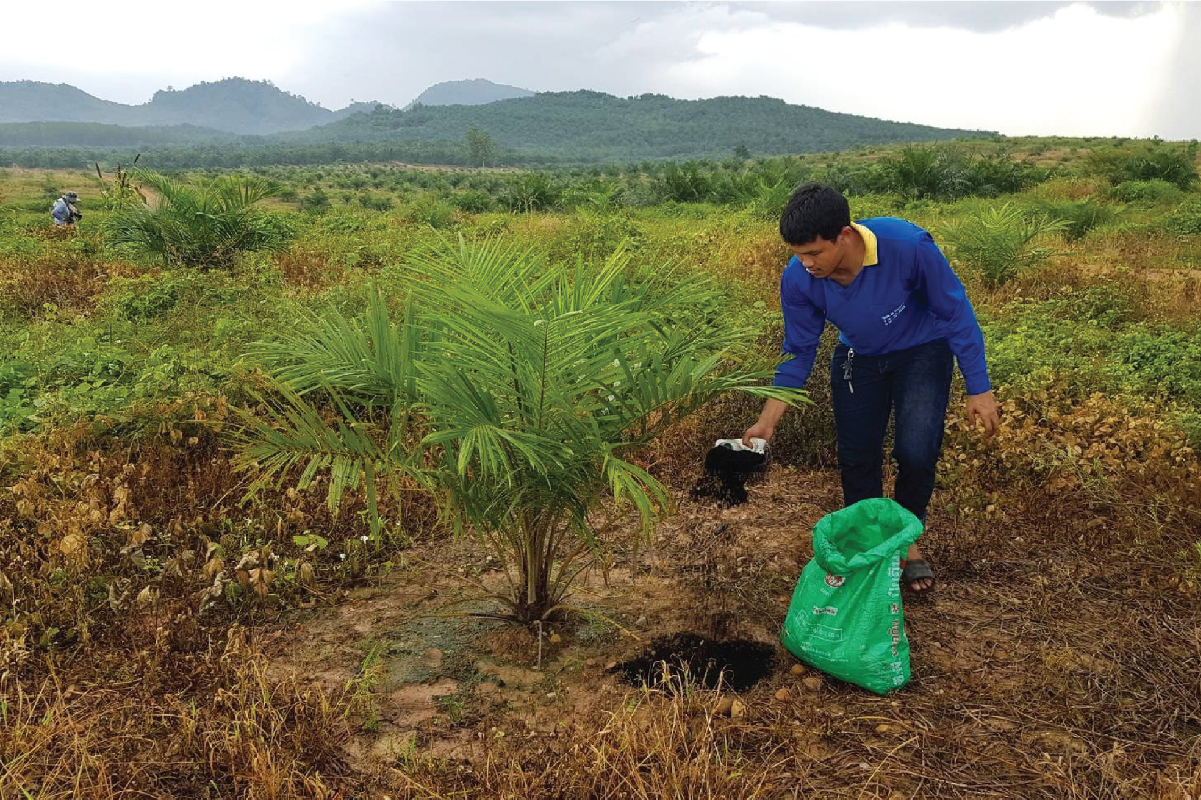
The final stage is the treatment of collected food waste, where the university prioritizes maximizing resource recovery. Part of the food waste is reused as animal feed at the Center for Smart Farming and Landscape Architecture, which not only reduces waste but also lowers the cost of animal feed. At the same time, suitable food waste is recycled into biogas and organic fertilizer, which are then reused in the university’s agricultural activities, creating a closed-loop system. Food waste that cannot be reused is disposed of through controlled incineration or landfill processes, strictly following pollution control measures to prevent adverse impacts on the environment and surrounding communities.
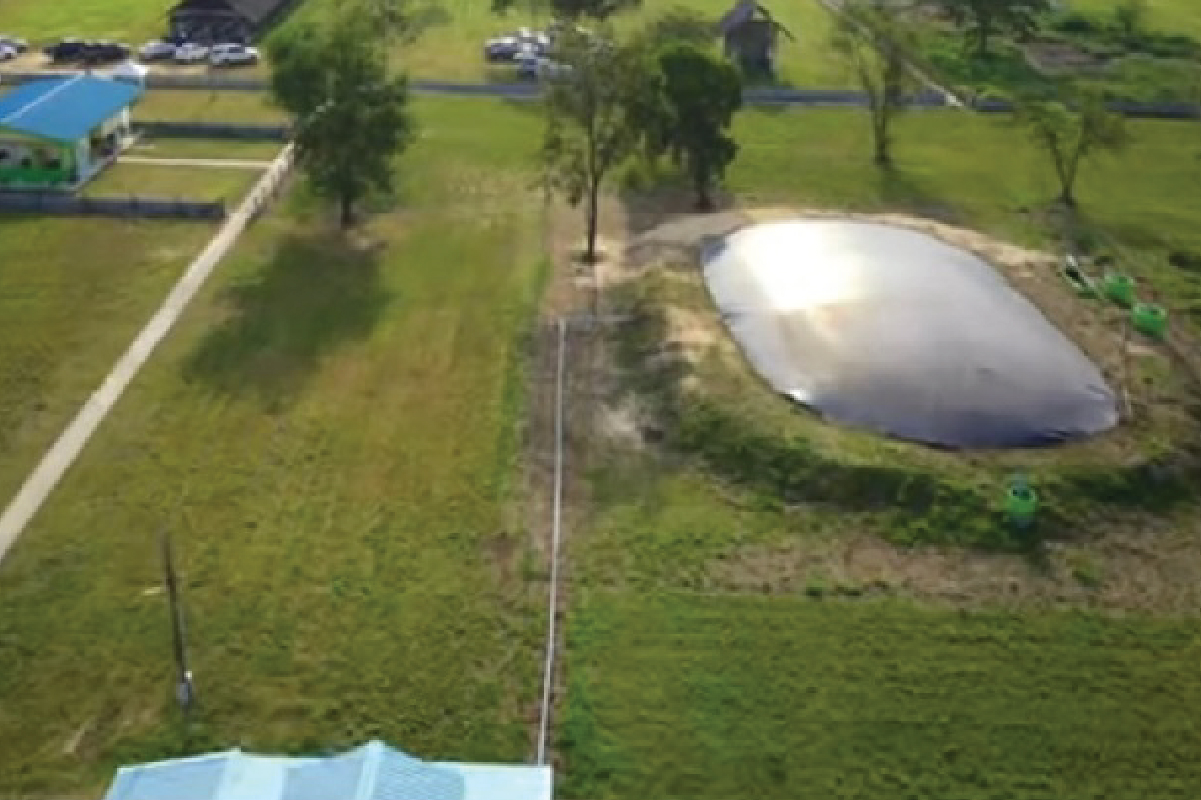
Figures : the food waste is Reusing as animal feed
Figures : biogas
Figures : organic fertilizer
Figures : Disposal
Figures : Landfill
From diagnostics to understand the real situation of campus food waste, Walailak University has been developing a system to reduce food waste generated across the campus through the engagement of staff and students, resulting in a measured total of 7.258 metric tons.
This entire system reflects Walailak University’s strong commitment to becoming a model educational institution that prioritizes sustainable resource management, particularly in reducing food waste, which is one of the key goals of the global Sustainable Development Agenda. At the same time, it fosters long-term environmental awareness among staff and students alike.


